Technical Analysis of SUB 2024-05-10
Overview:
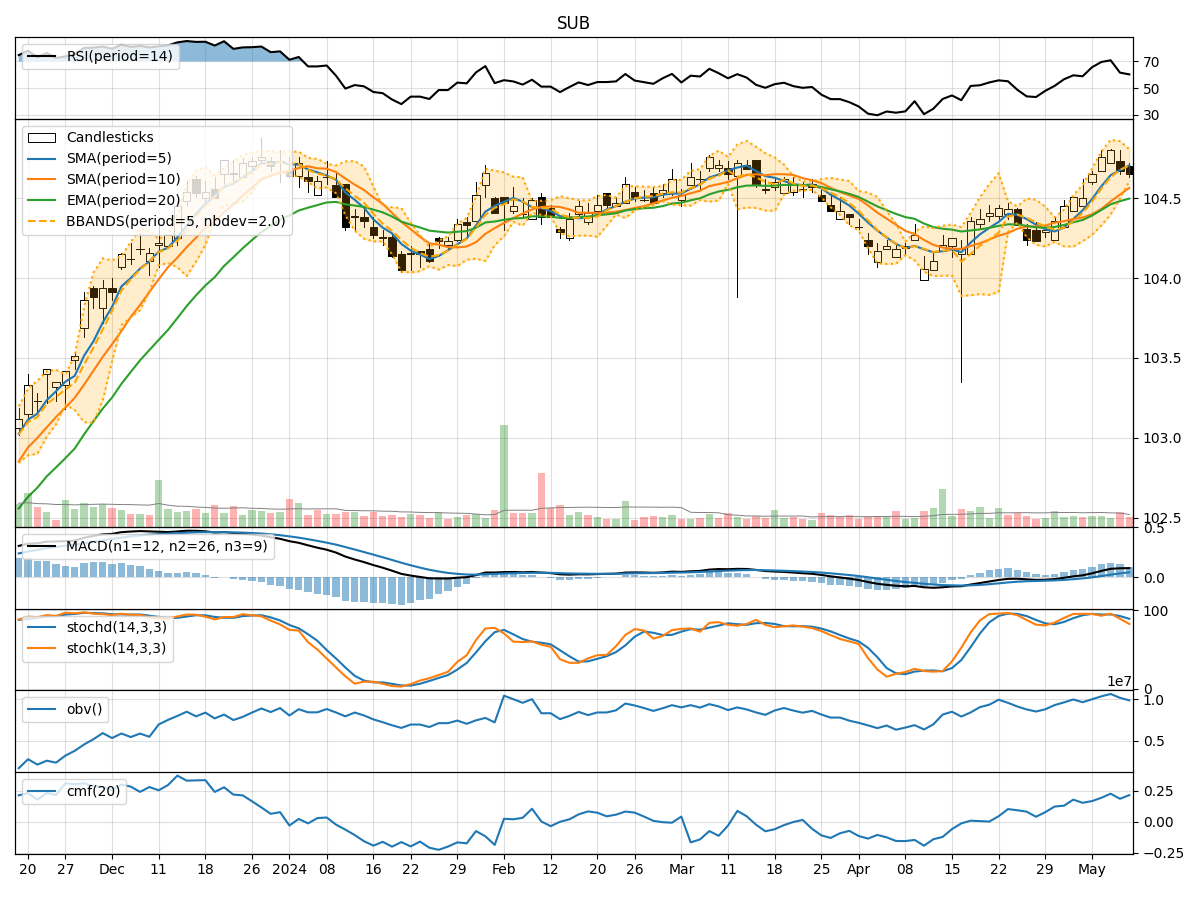
In the last 5 trading days, the stock has shown relatively stable price movements with minor fluctuations. The trend indicators suggest a gradual uptrend, supported by moving averages and MACD signals. Momentum indicators indicate a slightly overbought condition, while volatility indicators show narrowing Bollinger Bands. Volume indicators reflect mixed signals with fluctuating OBV and CMF values.
Trend Indicators Analysis:
- Moving Averages (MA): The 5-day MA has been consistently above the closing prices, indicating a short-term uptrend.
- MACD: The MACD line has been above the signal line, suggesting bullish momentum.
Key Observation: The stock is in an upward trend based on moving averages and MACD signals.
Momentum Indicators Analysis:
- RSI: The RSI values have been in the overbought territory, indicating a potential reversal or consolidation.
- Stochastic Oscillator: Both %K and %D values have been relatively high, signaling an overbought condition.
Key Observation: Momentum indicators suggest a potential reversal or consolidation due to overbought conditions.
Volatility Indicators Analysis:
- Bollinger Bands (BB): The bands have been narrowing, indicating decreasing volatility and a possible upcoming breakout.
Key Observation: Volatility is contracting, suggesting a potential increase in price movement.
Volume Indicators Analysis:
- On-Balance Volume (OBV): The OBV values have been fluctuating, reflecting mixed buying and selling pressure.
- Chaikin Money Flow (CMF): The CMF values have been positive but fluctuating, indicating some buying interest.
Key Observation: Volume indicators show mixed signals with no clear direction.
Conclusion:
Based on the analysis of technical indicators: - Trend: The stock is in an upward trend. - Momentum: Momentum indicators suggest a potential reversal or consolidation. - Volatility: Volatility is contracting, hinting at a possible breakout. - Volume: Volume indicators show mixed signals with no clear trend.
Possible Stock Price Movement:
Considering the overall analysis, the stock is likely to experience a short-term consolidation or a minor pullback due to overbought momentum indicators. However, the narrowing Bollinger Bands indicate a potential breakout, which could lead to a resumption of the uptrend in the near future. Traders should watch for a breakout above the upper Bollinger Band as a signal for a bullish continuation.