Technical Analysis of STOT 2024-05-10
Overview:
In analyzing the provided Technical Analysis (TA) data for the last 5 days, we will delve into the trend, momentum, volatility, and volume indicators to forecast the possible stock price movement for the next few days. By examining these key indicators, we aim to provide a comprehensive and insightful analysis to guide your decision-making process.
Trend Indicators:
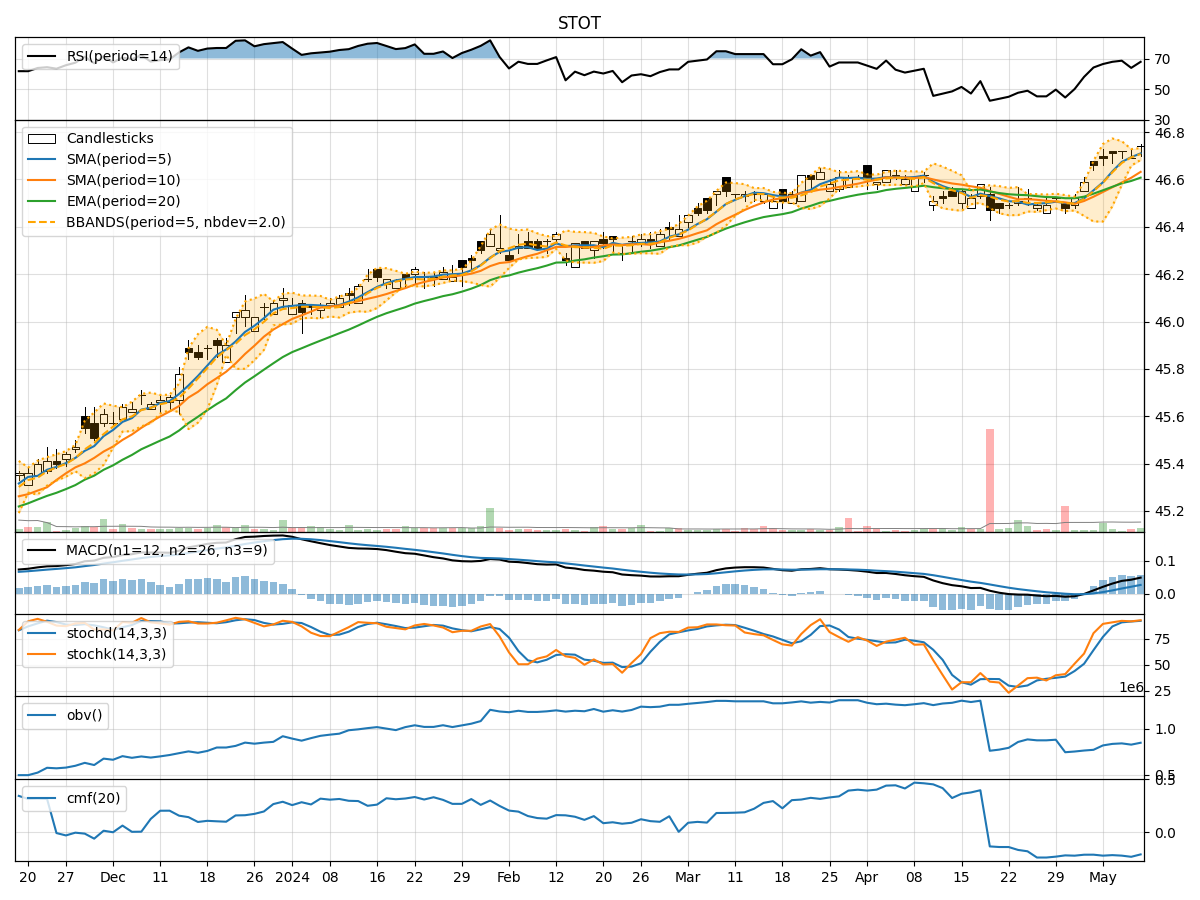
- Moving Averages (MA): The 5-day Moving Average (MA) has been consistently increasing, indicating a bullish trend in the short term.
- MACD: The Moving Average Convergence Divergence (MACD) has been steadily rising, with the MACD line consistently above the signal line, suggesting bullish momentum.
- EMA: The Exponential Moving Average (EMA) has shown an upward trajectory, supporting the bullish trend.
Key Observation: The trend indicators collectively suggest a strong bullish sentiment in the stock price movement.
Momentum Indicators:
- RSI: The Relative Strength Index (RSI) has been fluctuating within the overbought territory, indicating strong buying momentum.
- Stochastic Oscillator: Both %K and %D lines of the Stochastic Oscillator are in the overbought zone, signaling a potential reversal.
- Williams %R: The Williams %R is in the oversold region, suggesting a possible buying opportunity.
Key Observation: Momentum indicators show conflicting signals, with RSI indicating overbought conditions while Williams %R suggests oversold levels.
Volatility Indicators:
- Bollinger Bands (BB): The Bollinger Bands have been narrowing, indicating decreasing volatility and a potential price breakout.
- BB% (Bollinger Band %B): The %B is fluctuating around the midline, suggesting a period of consolidation.
Key Observation: Volatility indicators point towards a period of consolidation and potential price breakout.
Volume Indicators:
- On-Balance Volume (OBV): The OBV has been fluctuating, indicating mixed buying and selling pressure.
- Chaikin Money Flow (CMF): The CMF has been negative, suggesting a lack of buying interest.
Key Observation: Volume indicators reflect a lack of strong buying interest and mixed trading activity.
Conclusion:
Based on the analysis of the trend, momentum, volatility, and volume indicators, the next few days' possible stock price movement is likely to be sideways with a potential for a bullish breakout. The bullish trend indicated by moving averages and MACD, coupled with decreasing volatility and potential price breakout suggested by Bollinger Bands, may lead to a sideways movement with an upward bias.
Recommendation: Consider monitoring the price closely for a breakout above the upper Bollinger Band as a potential entry point for a bullish trade. However, remain cautious of the conflicting signals from momentum indicators and the lack of strong buying interest indicated by volume indicators.
Always remember to conduct further analysis and consider other factors before making any investment decisions.