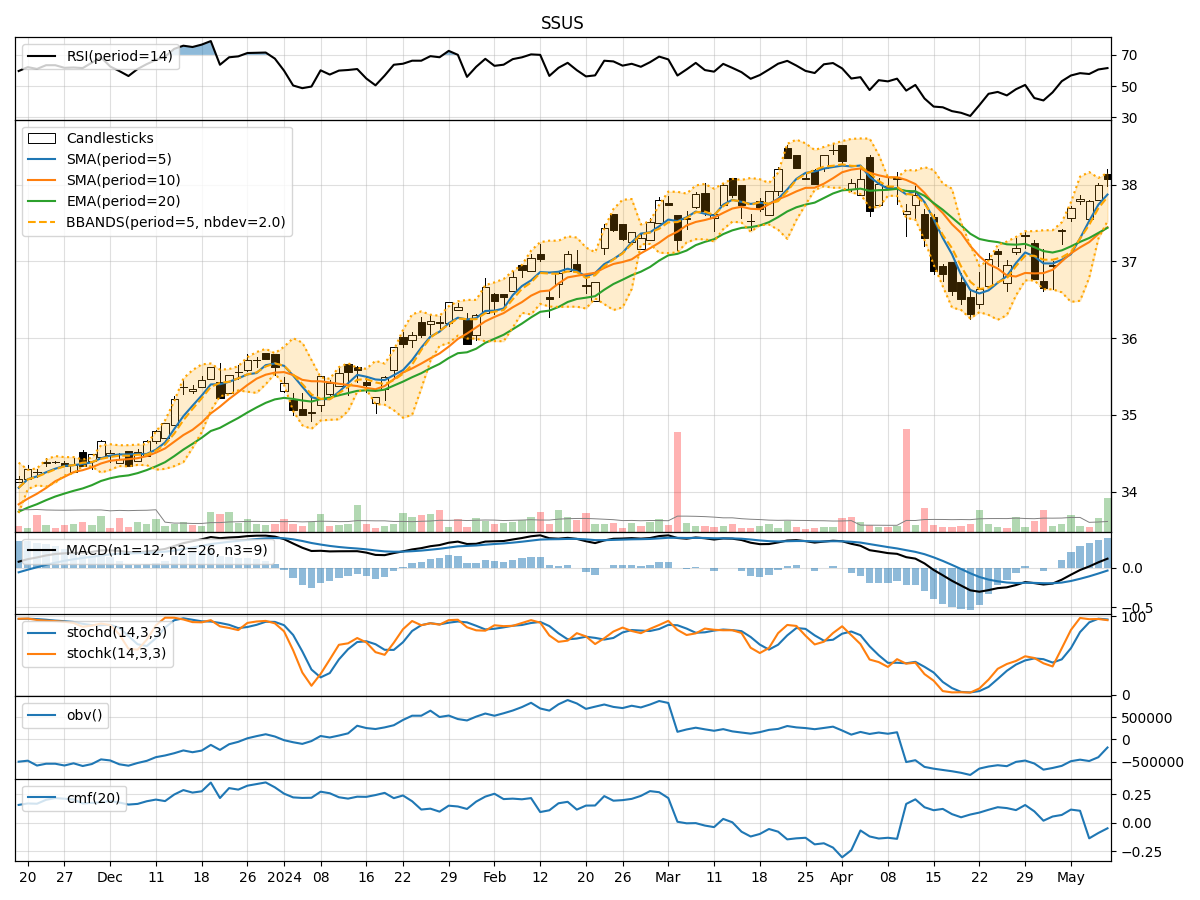
Technical Analysis of SSUS 2024-05-10
Overview:
In analyzing the technical indicators for SSUS stock over the last 5 days, we will delve into the trend, momentum, volatility, and volume indicators to provide a comprehensive outlook on the possible stock price movement in the coming days. By examining these key indicators, we aim to offer valuable insights and predictions for potential investors.
Trend Indicators:
- Moving Averages (MA): The 5-day MA has been consistently above the closing prices, indicating a short-term uptrend.
- MACD: The MACD line has been positive and increasing, suggesting bullish momentum.
- EMA: The EMA has been trending upwards, supporting the bullish sentiment.
Key Observation: The trend indicators point towards a bullish outlook for SSUS stock.
Momentum Indicators:
- RSI: The RSI has been in the neutral to slightly overbought territory, indicating potential strength in the current uptrend.
- Stochastic Oscillator: Both %K and %D have been in the overbought zone, signaling strong buying pressure.
- Williams %R: The indicator has been in the oversold region, suggesting a potential reversal.
Key Observation: Momentum indicators reflect a bullish sentiment with some signs of overbought conditions.
Volatility Indicators:
- Bollinger Bands: The stock price has been trading within the bands, indicating moderate volatility.
- Bollinger %B: The %B indicator has been hovering around the midline, suggesting a balanced market sentiment.
Key Observation: Volatility indicators suggest a sideways movement with no extreme fluctuations.
Volume Indicators:
- On-Balance Volume (OBV): The OBV has been fluctuating, indicating mixed buying and selling pressure.
- Chaikin Money Flow (CMF): The CMF has been negative, signaling potential distribution.
Key Observation: Volume indicators show a neutral stance with no clear dominance of buying or selling pressure.
Conclusion:
Based on the analysis of trend, momentum, volatility, and volume indicators, the overall outlook for SSUS stock in the next few days leans towards a bullish bias. The trend indicators support a continued uptrend, while momentum indicators suggest strength in the current move. Volatility indicators point towards a sideways movement with moderate fluctuations, and volume indicators indicate a balanced buying and selling pressure.
In conclusion, the next few days for SSUS stock are likely to see an upward movement with potential for further gains. Investors may consider maintaining or initiating long positions based on the technical analysis provided.