Technical Analysis of SSPY 2024-05-10
Overview:
In analyzing the technical indicators for the last 5 days of SSPY stock, we will delve into the trend, momentum, volatility, and volume indicators to provide a comprehensive outlook on the possible stock price movement in the coming days. By examining these key indicators, we aim to offer valuable insights and predictions for informed decision-making.
Trend Indicators:
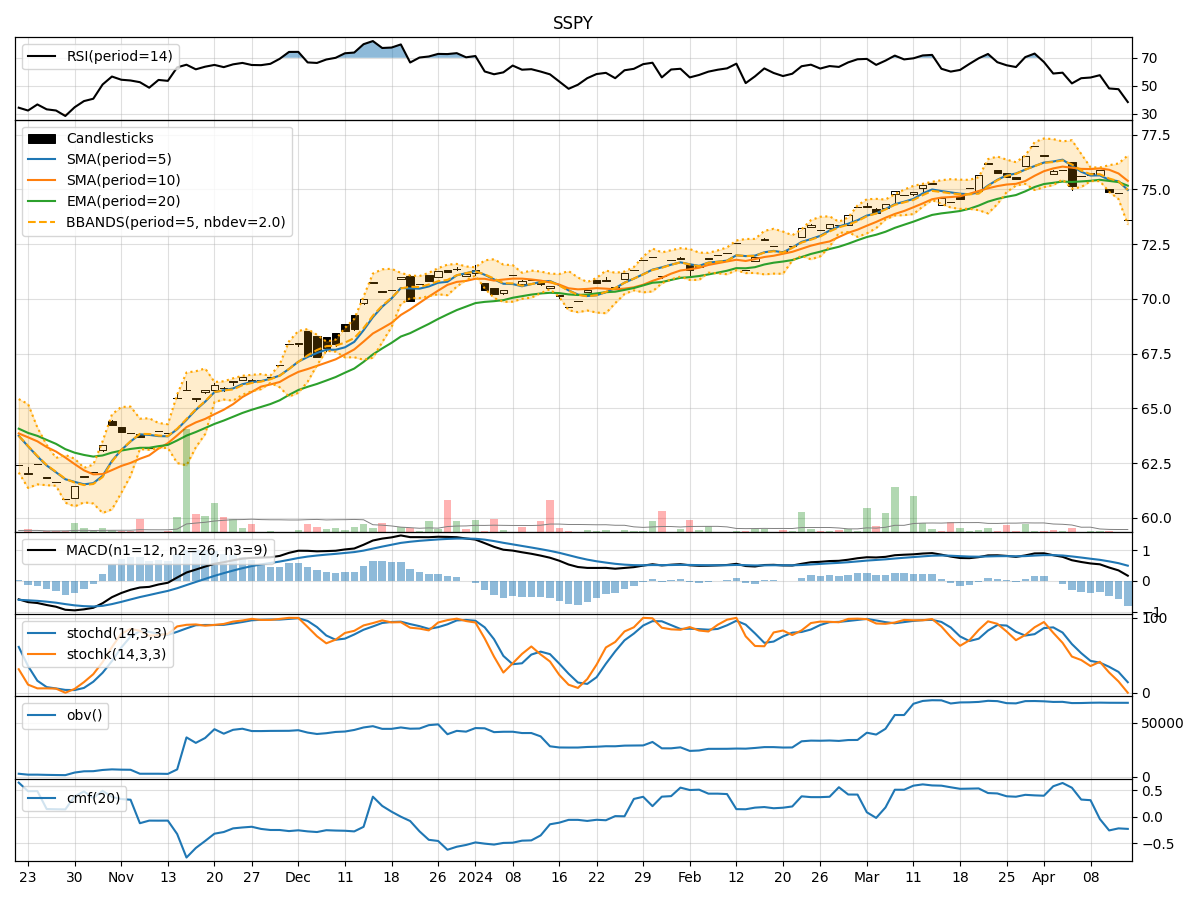
- Moving Averages (MA): The 5-day MA has been consistently above the 10-day SMA, indicating a short-term bullish trend.
- MACD: The MACD line has been positive, suggesting upward momentum in the stock price.
- RSI: The RSI has been fluctuating around the 50-70 range, indicating moderate bullish momentum.
- Bollinger Bands: The stock price has been trading within the upper Bollinger Band, signaling potential overbought conditions.
Momentum Indicators:
- Stochastic Oscillator: Both %K and %D have been in the overbought territory, suggesting a potential reversal or consolidation.
- Williams %R: The Williams %R has been consistently in the oversold region, indicating a possible reversal to the upside.
Volatility Indicators:
- Bollinger Bands Width: The BBW has been narrowing, indicating decreasing volatility and a potential period of consolidation.
- Average True Range (ATR): The ATR has been relatively stable, suggesting a lack of significant price fluctuations.
Volume Indicators:
- On-Balance Volume (OBV): The OBV has shown mixed signals, reflecting indecision among market participants.
- Chaikin Money Flow (CMF): The CMF has been negative, indicating selling pressure in the stock.
Key Observations and Opinions:
- Trend: The stock is in a short-term bullish trend based on moving averages and MACD.
- Momentum: The stochastic oscillator suggests overbought conditions, while Williams %R indicates a potential reversal.
- Volatility: Bollinger Bands and ATR point towards a period of consolidation or a potential decrease in volatility.
- Volume: Mixed signals from OBV and negative CMF indicate uncertainty in market sentiment.
Conclusion:
Based on the analysis of the technical indicators, the stock is likely to experience a period of consolidation in the coming days. The overbought conditions suggested by the stochastic oscillator may lead to a temporary pullback, while the narrowing Bollinger Bands Width indicates reduced volatility. Investors should monitor key support and resistance levels for potential entry or exit points. Exercise caution and consider waiting for clearer signals before making significant trading decisions.