Technical Analysis of SRTY 2024-05-10
Overview:
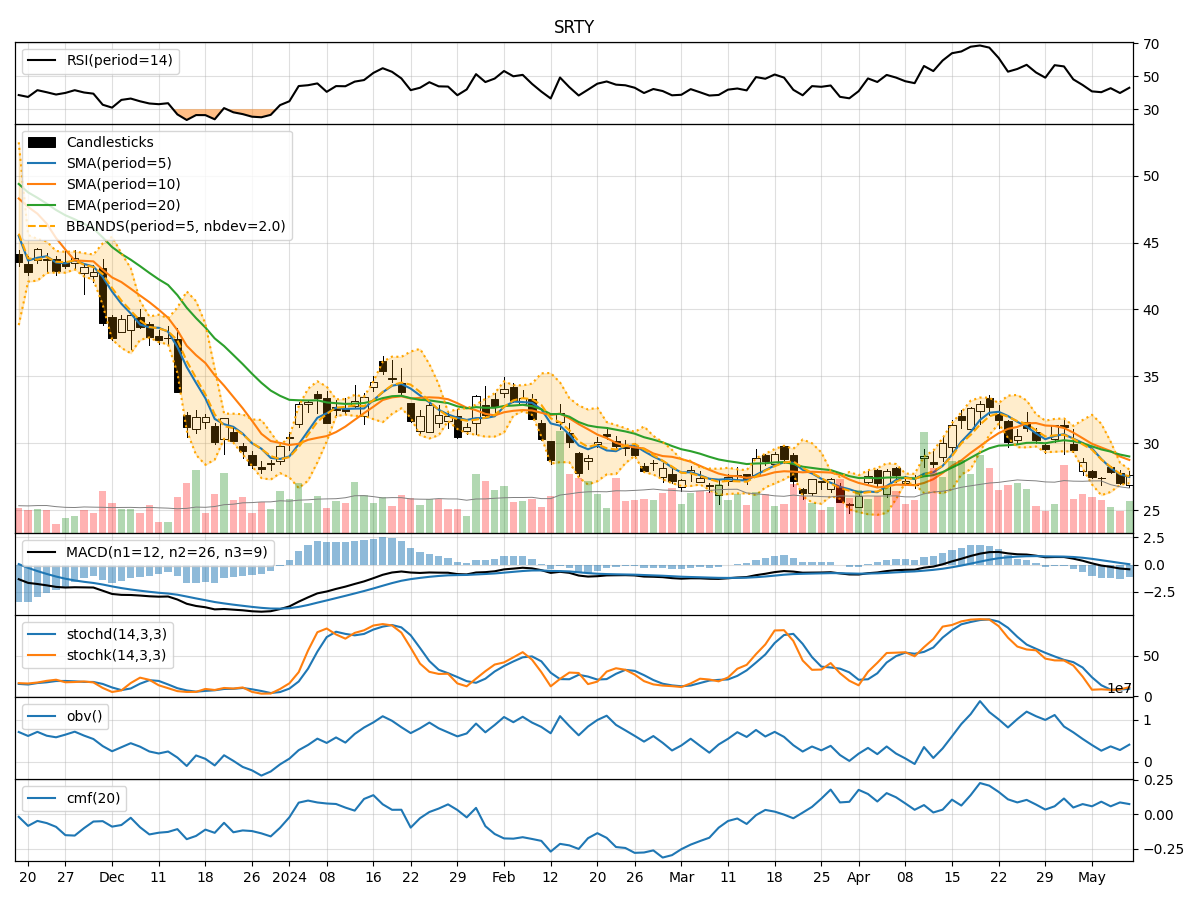
In analyzing the technical indicators for SRTY over the last 5 days, we will delve into the trend, momentum, volatility, and volume indicators to provide a comprehensive outlook on the possible stock price movement in the coming days.
Trend Indicators:
- Moving Averages (MA): The 5-day MA has been consistently below the closing prices, indicating a short-term downtrend.
- MACD: The MACD line has been below the signal line, suggesting a bearish momentum.
- EMA: The EMA has been declining, reflecting a weakening trend.
Momentum Indicators:
- RSI: The RSI has been hovering around the oversold territory, indicating a potential reversal or consolidation.
- Stochastic Oscillator: Both %K and %D have been relatively low, signaling a potential oversold condition.
- Williams %R: The indicator has been in the oversold region, suggesting a possible reversal.
Volatility Indicators:
- Bollinger Bands: The stock price has been trading below the lower Bollinger Band, indicating oversold conditions.
- Bollinger %B: The %B indicator has been below 0.2, signaling potential undervaluation.
- Average True Range (ATR): The ATR has been relatively low, indicating decreased volatility.
Volume Indicators:
- On-Balance Volume (OBV): The OBV has been negative, suggesting distribution and selling pressure.
- Chaikin Money Flow (CMF): The CMF has been positive but relatively low, indicating some buying interest.
Key Observations:
- The stock is currently in a downtrend based on moving averages and MACD.
- Momentum indicators suggest a potential reversal or consolidation as the stock is in oversold territory.
- Volatility indicators point towards low volatility and potential undervaluation.
- Volume indicators indicate selling pressure but with some buying interest.
Conclusion:
Based on the analysis of the technical indicators, the next few days' possible stock price movement for SRTY could see a short-term reversal or consolidation. The stock is currently oversold, and with low volatility, there might be a potential for a bounce back or sideways movement in the near future. However, it is crucial to monitor the price action closely for any signs of a confirmed trend reversal before considering any significant positions.