Technical Analysis of SPYT 2024-05-10
Overview:
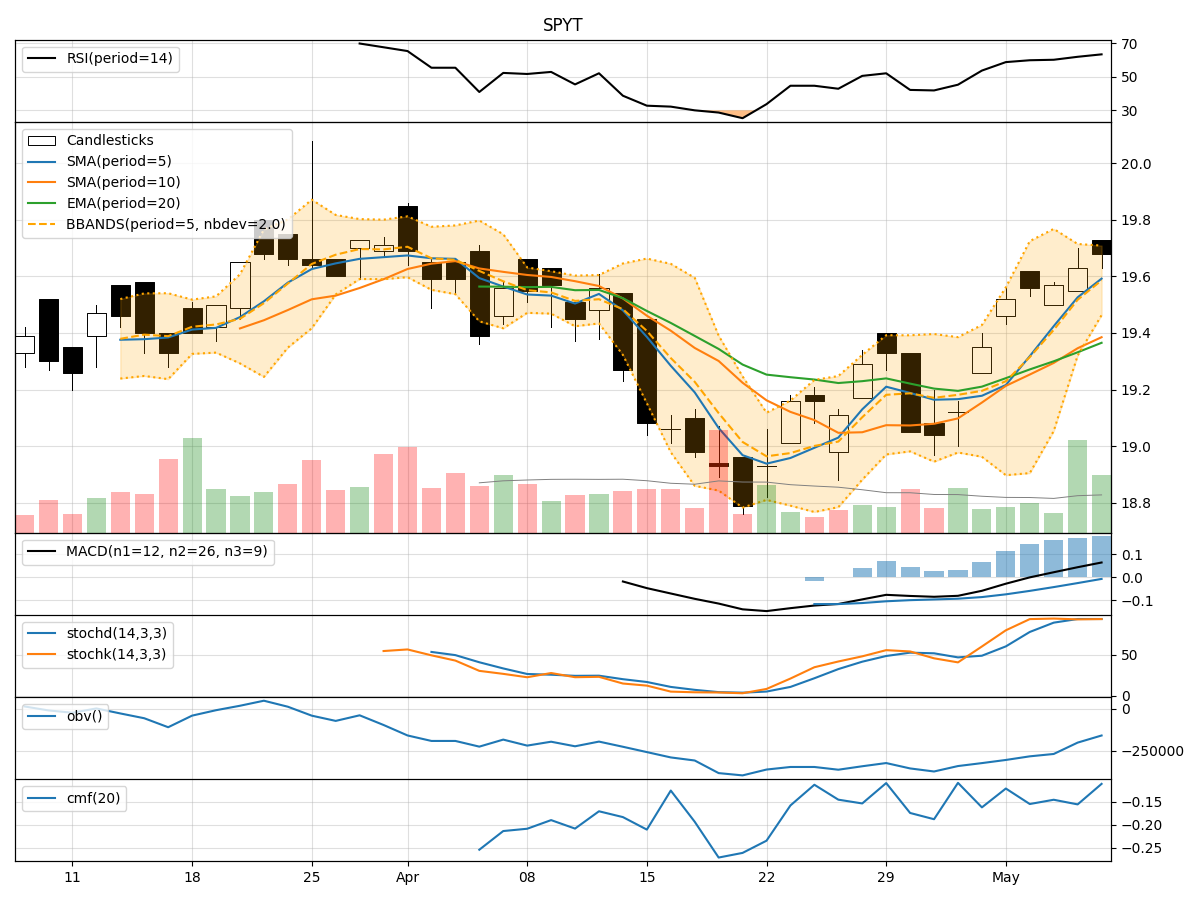
In the last 5 trading days, SPYT has shown a consistent uptrend in its closing price, accompanied by increasing volumes. The moving averages have been trending upwards, indicating a positive momentum. The MACD and RSI are also showing bullish signals. However, the stock is currently trading near the upper Bollinger Band, suggesting a potential overbought condition. Let's delve deeper into each category of technical indicators to provide a comprehensive analysis and make a prediction for the next few days.
Trend Indicators:
- Moving Averages (MA): The 5-day MA has been consistently above the 10-day SMA, indicating a short-term bullish trend. The EMA(20) is also trending upwards, supporting the bullish momentum.
- MACD: The MACD line has been above the signal line for the past 5 days, indicating a bullish trend. The MACD histogram is also showing an increasing positive value, suggesting strengthening bullish momentum.
Momentum Indicators:
- RSI: The RSI has been steadily increasing and is currently in the overbought territory above 70, indicating a strong bullish momentum.
- Stochastic Oscillator: Both %K and %D lines of the Stochastic Oscillator are in the overbought zone, suggesting a potential reversal or consolidation in the near future.
Volatility Indicators:
- Bollinger Bands (BB): The stock price is currently trading near the upper Bollinger Band, indicating a potential overbought condition. A pullback or consolidation might be expected in the short term.
- Bollinger %B (BBP): The %B is above 0.8, indicating that the stock is trading at the upper end of its recent price range.
Volume Indicators:
- On-Balance Volume (OBV): The OBV has been showing a slight decrease over the last 5 days, suggesting some distribution happening despite the price increase.
- Chaikin Money Flow (CMF): The CMF(20) is negative, indicating that money flow has been slightly negative over the past 20 days.
Conclusion:
Based on the analysis of the technical indicators, the next few days for SPYT are likely to see a pullback or consolidation in the stock price. The overbought conditions indicated by the RSI, Stochastic Oscillator, and Bollinger Bands suggest a potential reversal or sideways movement. The decreasing OBV and negative CMF further support the view of a short-term correction. Traders may consider taking profits or waiting for a better entry point before considering long positions.