Technical Analysis of SPXT 2024-05-10
Overview:
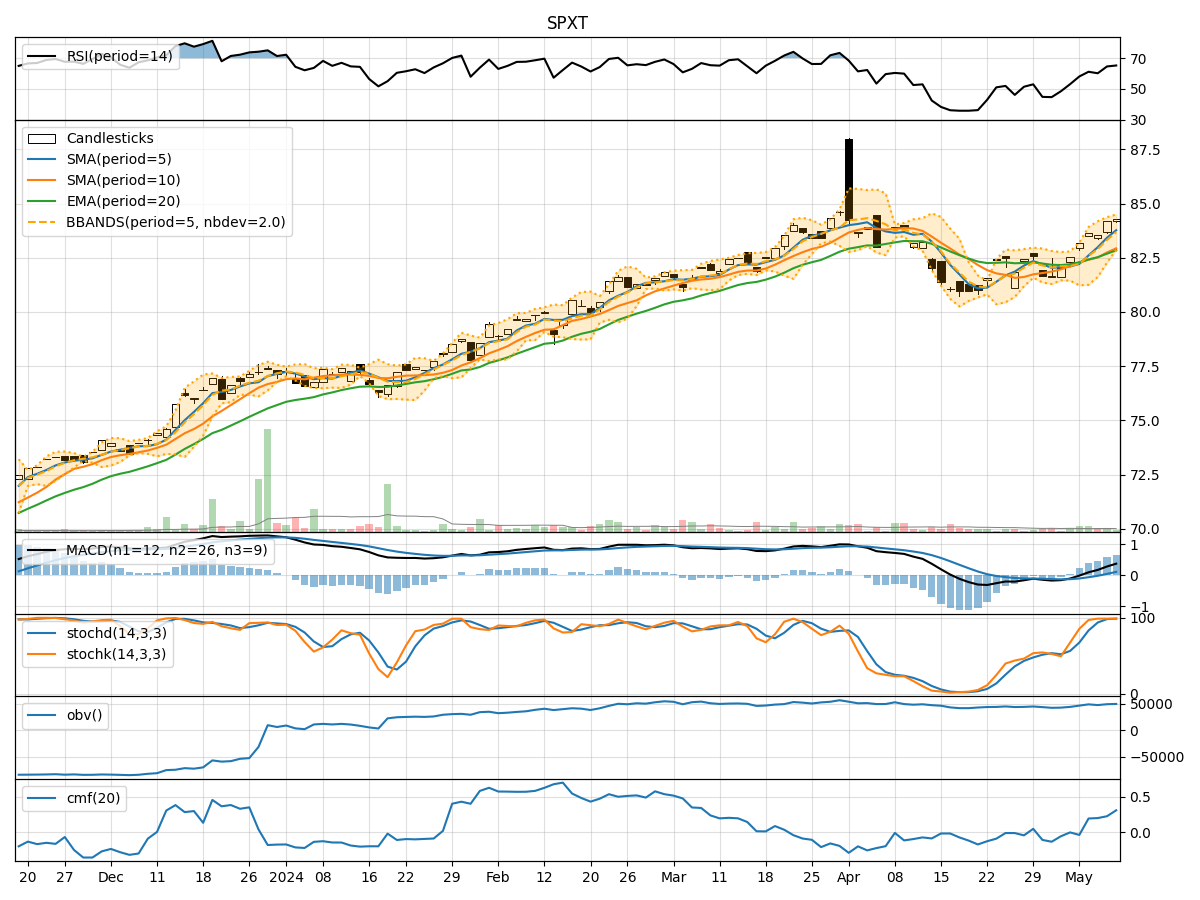
In the last 5 trading days, SPXT has shown a consistent uptrend in its closing price, accompanied by increasing volumes. The moving averages have been trending upwards, indicating a positive momentum. The MACD and RSI have also been on the rise, suggesting bullish momentum. Volatility has been relatively stable, and the OBV and CMF indicators show positive accumulation.
Trend Analysis:
- Moving Averages (MA): The 5-day MA has been consistently above the 10-day SMA, indicating a short-term bullish trend.
- MACD: The MACD line has been above the signal line, with both lines trending upwards, signaling a bullish momentum.
- EMA: The EMA has been steadily increasing, supporting the bullish trend.
Momentum Analysis:
- RSI: The RSI has been in the overbought territory but has room for further upside, suggesting continued bullish momentum.
- Stochastic Oscillator: Both %K and %D have been in the overbought zone, indicating strong buying pressure.
- Williams %R: The indicator has been hovering around the oversold region, suggesting potential for a reversal to the upside.
Volatility Analysis:
- Bollinger Bands: The price has been trading within the bands, indicating stable volatility.
Volume Analysis:
- On-Balance Volume (OBV): The OBV has been steadily increasing, reflecting positive accumulation by investors.
- Chaikin Money Flow (CMF): The CMF has been positive, indicating buying pressure and strong accumulation.
Key Observations:
- The technical indicators across trend, momentum, volatility, and volume suggest a strong bullish sentiment in the SPXT stock.
- The uptrend in closing prices, supported by increasing volumes and positive momentum indicators, indicates a healthy bullish trend.
- The stability in volatility and positive accumulation in volume indicators further support the bullish outlook for the stock.
Conclusion:
Based on the comprehensive analysis of the technical indicators, it is highly likely that SPXT will continue its upward trajectory in the next few trading days. The bullish trend is well-supported by the moving averages, MACD, RSI, and volume indicators, all pointing towards further price appreciation. Therefore, the next few days are expected to see continued upward movement in the stock price of SPXT. Investors may consider buying or holding positions in SPXT based on the strong technical signals indicating a bullish trend.