Technical Analysis of SPXS 2024-05-10
Overview:
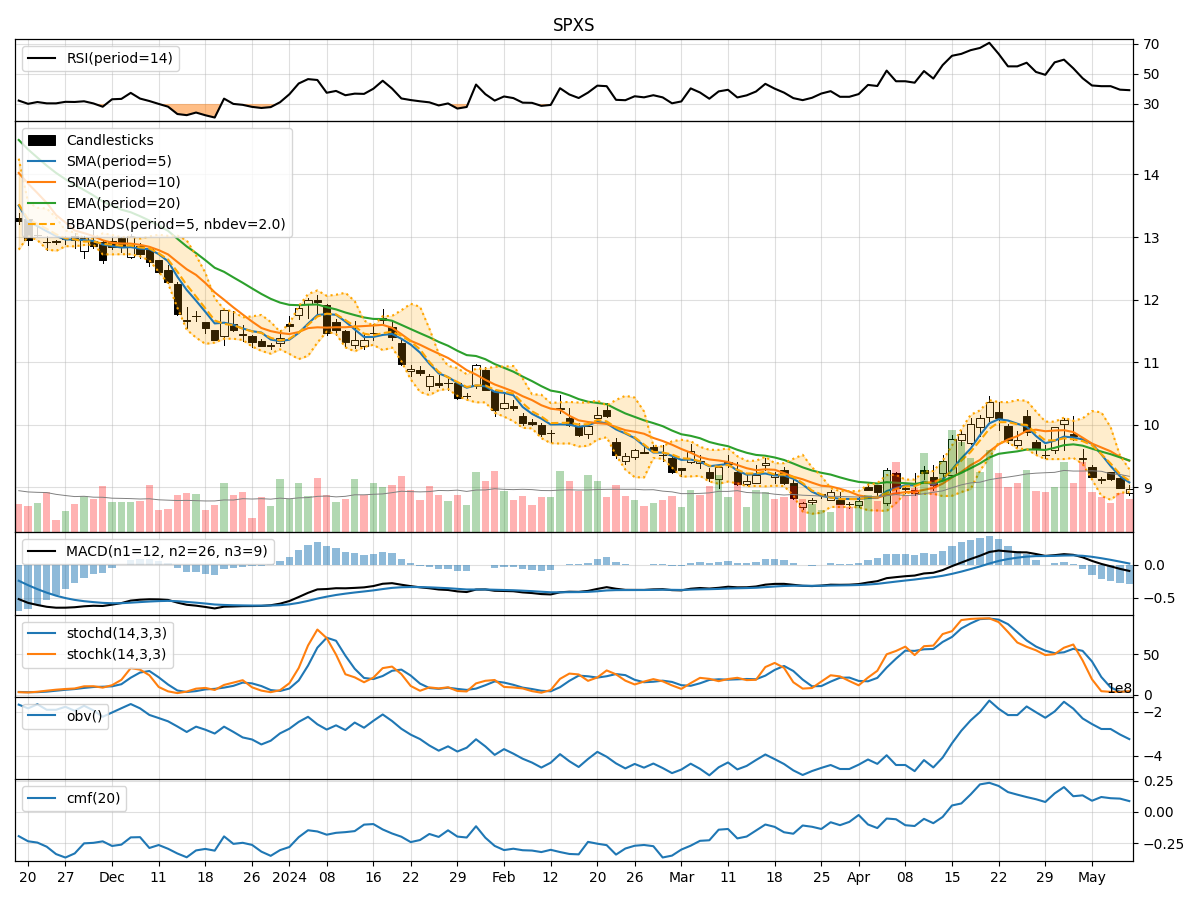
In analyzing the technical indicators for SPXS over the last 5 days, we will delve into the trend, momentum, volatility, and volume indicators to provide a comprehensive outlook on the possible stock price movement in the coming days.
Trend Analysis:
- Moving Averages (MA): The 5-day MA has been consistently below the closing price, indicating a downward trend.
- MACD: The MACD line has been below the signal line, suggesting a bearish momentum.
- EMA: The EMA has been declining, further supporting the bearish trend.
Momentum Analysis:
- RSI: The RSI has been below 50, indicating bearish momentum.
- Stochastic Oscillator: Both %K and %D have been in oversold territory, signaling a potential reversal.
- Williams %R: The indicator has been consistently in oversold territory, suggesting a bearish sentiment.
Volatility Analysis:
- Bollinger Bands: The price has been consistently below the lower Bollinger Band, indicating oversold conditions.
- Bollinger %B: The %B has been below 0.2, signaling potential undervaluation.
- Average True Range (ATR): The ATR has been relatively stable, indicating low volatility.
Volume Analysis:
- On-Balance Volume (OBV): The OBV has been declining, suggesting selling pressure.
- Chaikin Money Flow (CMF): The CMF has been positive but decreasing, indicating weakening buying pressure.
Key Observations:
- The trend indicators, momentum oscillators, and volume indicators all point towards a bearish sentiment in the short term.
- The oversold conditions indicated by various indicators suggest a potential reversal or consolidation phase.
- The declining OBV and weakening CMF indicate a lack of strong buying interest.
Conclusion:
Based on the analysis of the technical indicators, the outlook for SPXS in the next few days is bearish. The stock is likely to experience further downward pressure, potentially leading to lower prices. Traders should exercise caution and consider waiting for signs of a reversal or consolidation before considering any long positions.