Technical Analysis of SPXE 2024-05-10
Overview:
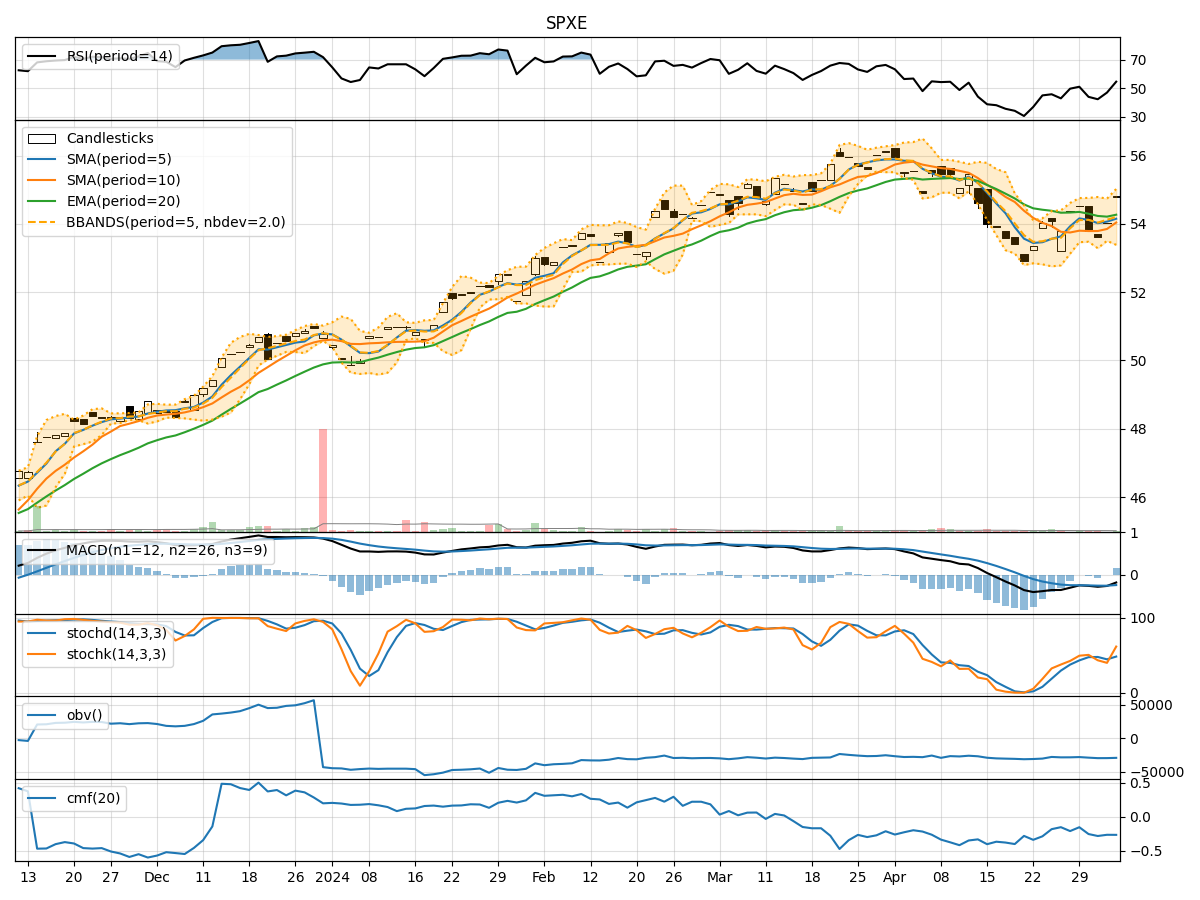
In analyzing the technical indicators for SPXE over the last 5 days, we will delve into the trend, momentum, volatility, and volume indicators to provide a comprehensive outlook on the possible stock price movement in the coming days.
Trend Indicators:
- Moving Averages (MA): The 5-day MA has been consistently above the 10-day SMA and 20-day EMA, indicating a bullish trend.
- MACD: The MACD line has been consistently above the signal line, with both lines showing an upward trend, suggesting bullish momentum.
- Conclusion: The trend indicators point towards a bullish outlook for SPXE.
Momentum Indicators:
- RSI: The RSI has been trending upwards and is currently in the overbought territory, indicating strong buying momentum.
- Stochastic Oscillator: Both %K and %D have been in the overbought zone, suggesting a strong bullish momentum.
- Conclusion: Momentum indicators signal a strong bullish sentiment for SPXE.
Volatility Indicators:
- Bollinger Bands (BB): The stock price has been consistently trading above the middle Bollinger Band, indicating an upward trend.
- Conclusion: Volatility indicators suggest a bullish trend for SPXE.
Volume Indicators:
- On-Balance Volume (OBV): The OBV has been steadily increasing, indicating strong buying pressure.
- Chaikin Money Flow (CMF): The CMF has been positive and rising, indicating bullish money flow.
- Conclusion: Volume indicators support a bullish sentiment for SPXE.
Overall Conclusion:
Based on the analysis of trend, momentum, volatility, and volume indicators, the collective outlook for SPXE is strongly bullish. The stock is exhibiting positive trends across all indicators, indicating a high probability of continued upward movement in the coming days. Traders and investors may consider taking long positions or holding onto existing positions to capitalize on the expected price appreciation.
Key Takeaways:
- Upward Trend: The stock is in a clear upward trend based on moving averages and MACD.
- Strong Momentum: Momentum indicators show strong buying momentum.
- Low Volatility: Bollinger Bands suggest low volatility with an upward bias.
- Positive Volume: Increasing OBV and positive CMF indicate strong buying interest.
Recommendation:
Given the overwhelmingly bullish signals from the technical indicators, it is advisable to consider buying or holding positions in SPXE for potential gains in the near term. However, it is essential to monitor the indicators regularly for any signs of reversal or divergence to adjust trading strategies accordingly.