Technical Analysis of SPTE 2024-05-10
Overview:
In analyzing the technical indicators for SPTE over the last 5 days, we will delve into the trend, momentum, volatility, and volume indicators to provide a comprehensive outlook on the possible stock price movement. By examining these key aspects, we aim to offer valuable insights and predictions for the upcoming days.
Trend Analysis:
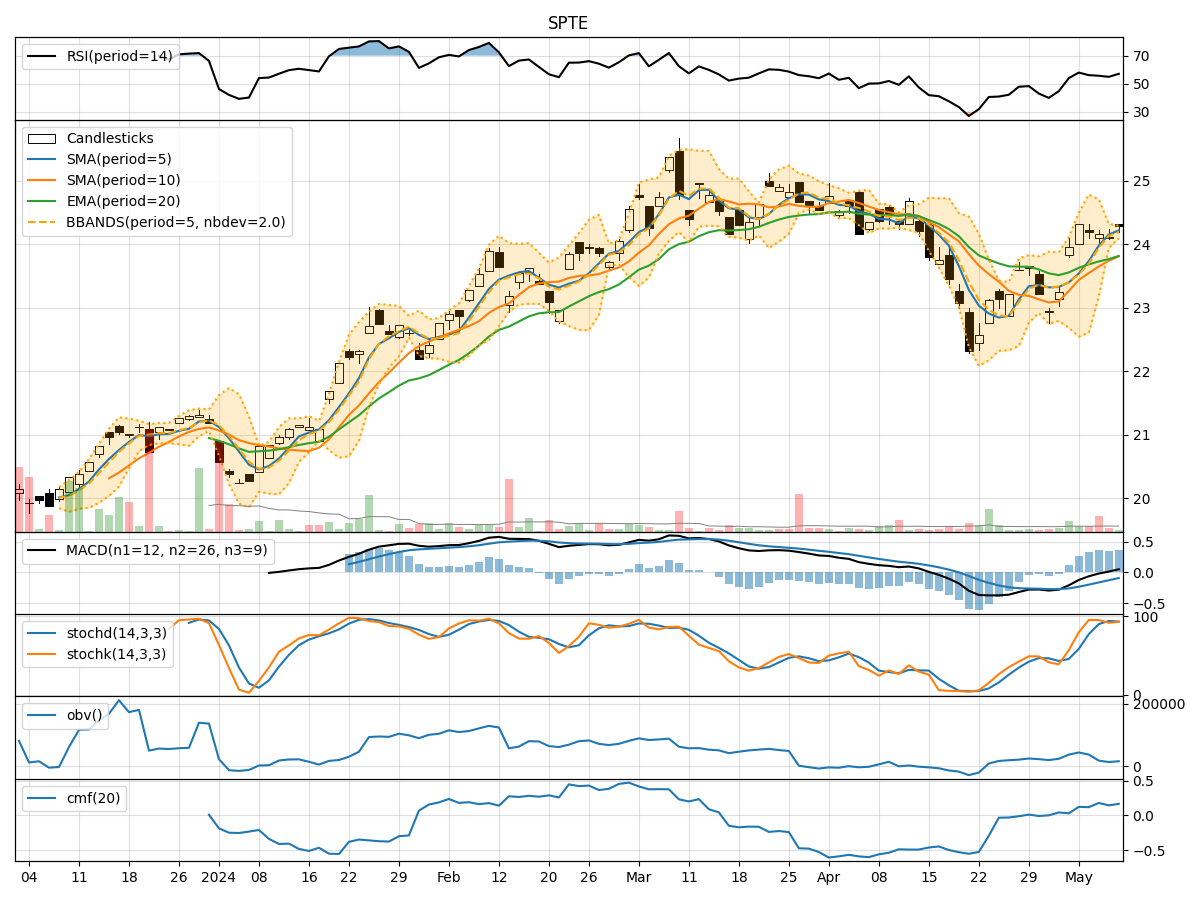
- Moving Averages (MA): The 5-day Moving Average (MA) has been consistently above the Simple Moving Average (SMA) and Exponential Moving Average (EMA), indicating a bullish trend.
- MACD: The MACD line has been consistently above the signal line, suggesting a positive momentum in the stock price.
- RSI: The Relative Strength Index (RSI) has been fluctuating around the neutral zone, indicating a balanced momentum in the stock.
Momentum Analysis:
- Stochastic Oscillator: The Stochastic Oscillator has been hovering in the overbought territory, suggesting a potential reversal or consolidation in the stock price.
- Williams %R: The Williams %R indicator has been fluctuating around the oversold region, indicating a possible buying opportunity.
Volatility Analysis:
- Bollinger Bands (BB): The Bollinger Bands have been narrowing, indicating decreasing volatility in the stock price.
- Average True Range (ATR): The ATR has been relatively stable, suggesting a consistent level of volatility in the stock.
Volume Analysis:
- On-Balance Volume (OBV): The OBV has been showing a mixed trend, indicating indecision among investors regarding the stock.
- Chaikin Money Flow (CMF): The CMF has been fluctuating around the zero line, suggesting a neutral sentiment in the stock.
Conclusion:
Based on the analysis of the technical indicators, the stock of SPTE is likely to experience sideways movement in the next few days. The trend indicators point towards a bullish bias, supported by the moving averages and MACD. However, the momentum indicators suggest a potential reversal due to overbought conditions in the Stochastic Oscillator.
Moreover, the volatility indicators indicate a decreasing level of volatility, which could lead to a period of consolidation. The volume indicators reflect indecisiveness among investors, further supporting the sideways movement hypothesis.
In conclusion, while the overall trend remains bullish, caution is advised due to the potential reversal signals in the momentum indicators. Traders should closely monitor key support and resistance levels for potential entry and exit points.