Technical Analysis of SPHQ 2024-05-10
Overview:
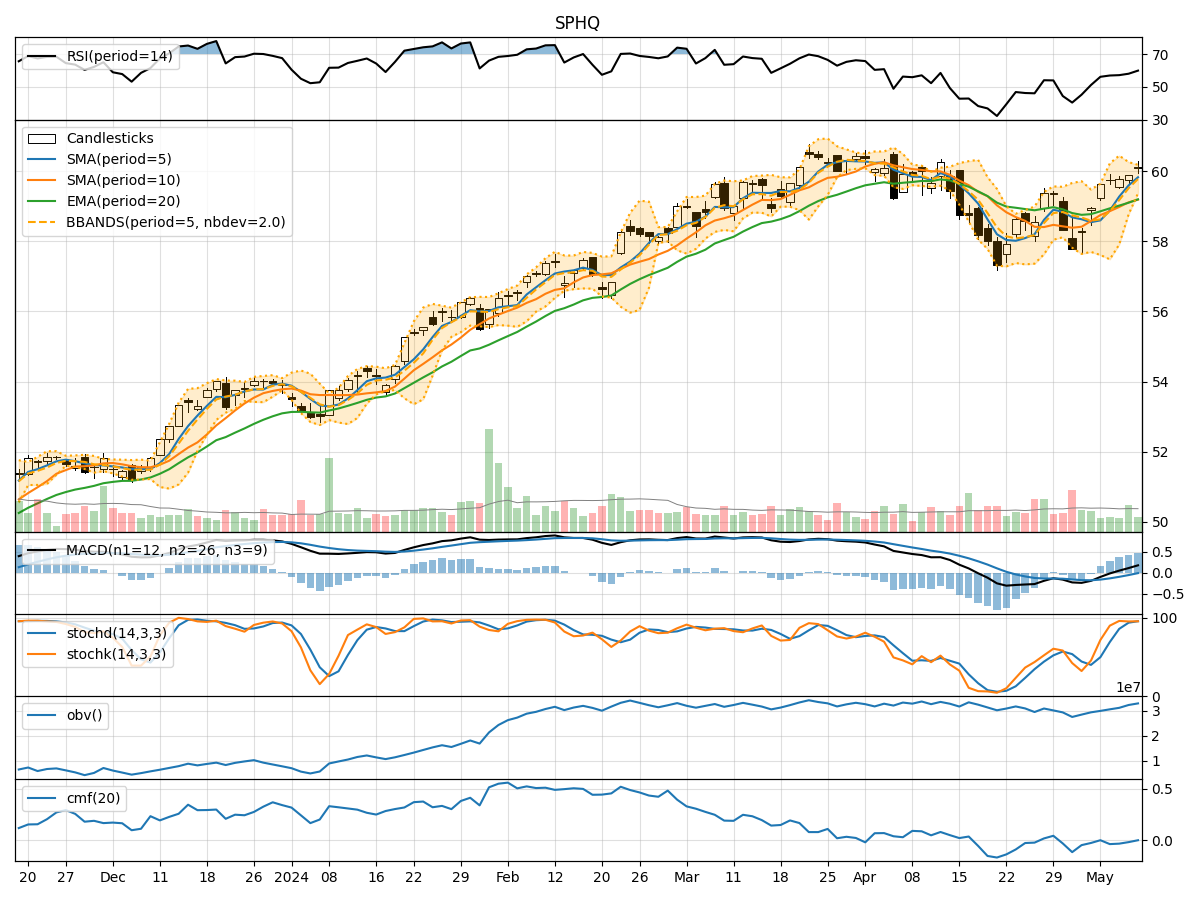
In analyzing the technical indicators for SPHQ over the last 5 days, we will delve into the trend, momentum, volatility, and volume indicators to provide a comprehensive outlook on the possible stock price movement in the coming days. By examining these key indicators, we aim to offer valuable insights and predictions for informed decision-making.
Trend Analysis:
- Moving Averages (MA): The 5-day Moving Average has been consistently trending upwards, indicating a positive momentum in the stock price.
- MACD: The MACD line has been above the signal line for the past 5 days, suggesting a bullish trend.
- RSI: The Relative Strength Index has been increasing, showing strengthening buying pressure.
Key Observation: The trend indicators point towards a bullish outlook for SPHQ.
Momentum Analysis:
- Stochastic Oscillator: Both %K and %D have been in the overbought zone, indicating a strong upward momentum.
- Williams %R: The Williams %R is in the oversold territory, suggesting a potential reversal in the short term.
Key Observation: Momentum indicators signal a strong bullish sentiment for SPHQ.
Volatility Analysis:
- Bollinger Bands: The stock price has been trading close to the upper Bollinger Band, indicating high volatility.
- Bollinger %B: The %B value is above 0.8, suggesting the stock is trading at the upper range of volatility.
Key Observation: Volatility indicators reflect high volatility in SPHQ.
Volume Analysis:
- On-Balance Volume (OBV): The OBV has been steadily increasing, indicating strong buying volume.
- Chaikin Money Flow (CMF): The CMF has been slightly negative, suggesting some distribution in the stock.
Key Observation: Volume indicators show mixed signals with strong buying volume but some distribution.
Conclusion:
Based on the analysis of trend, momentum, volatility, and volume indicators, the overall outlook for SPHQ is strongly bullish. The stock is likely to continue its upward trajectory in the coming days, supported by positive trends, strong momentum, and high volatility. Traders and investors may consider buying opportunities in SPHQ for potential short to medium-term gains. However, it is essential to monitor the indicators closely for any signs of reversal or consolidation in the market.