Technical Analysis of SPAB 2024-05-10
Overview:
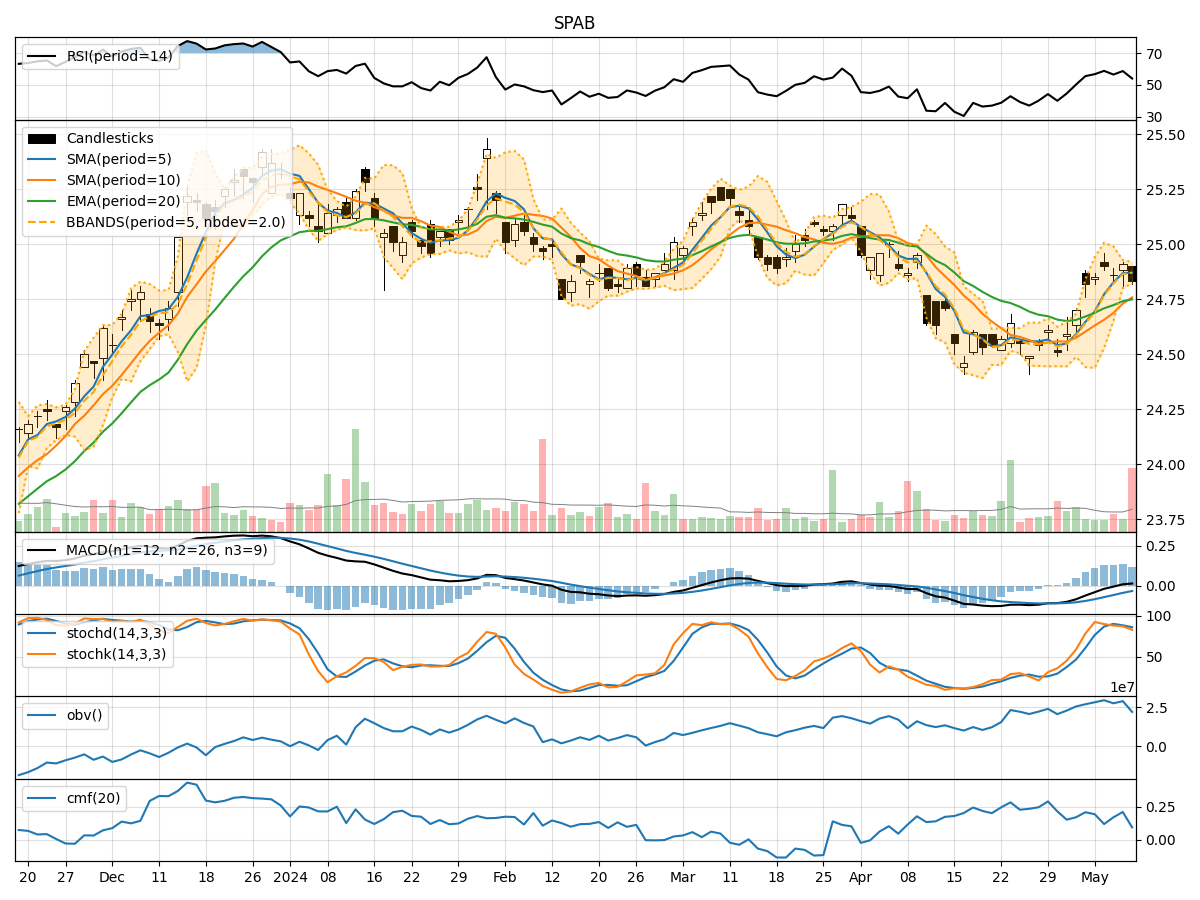
In analyzing the technical indicators for SPAB over the last 5 days, we will delve into the trend, momentum, volatility, and volume indicators to provide a comprehensive outlook on the possible stock price movement in the coming days.
Trend Analysis:
- Moving Averages (MA): The 5-day Moving Average (MA) has been consistently above the Simple Moving Average (SMA) and Exponential Moving Average (EMA), indicating a short-term uptrend.
- MACD: The MACD line has been positive, showing bullish momentum, although the MACD Histogram has been decreasing slightly.
Momentum Analysis:
- RSI: The Relative Strength Index (RSI) has been fluctuating around the neutral level of 50, suggesting a lack of strong momentum in either direction.
- Stochastic Oscillator: Both %K and %D have been declining, indicating a potential shift towards oversold conditions.
Volatility Analysis:
- Bollinger Bands (BB): The stock price has been trading within the Bollinger Bands, with the bands narrowing, suggesting decreasing volatility.
Volume Analysis:
- On-Balance Volume (OBV): The OBV has been relatively stable, indicating a balance between buying and selling pressure.
- Chaikin Money Flow (CMF): The CMF has been positive, reflecting buying pressure in the market.
Key Observations:
- The trend indicators suggest a short-term uptrend in the stock price.
- Momentum indicators show a lack of strong momentum in either direction.
- Volatility has been decreasing, indicating a potential period of consolidation.
- Volume indicators reflect a balance between buying and selling pressure.
Conclusion:
Based on the analysis of the technical indicators, the stock price of SPAB is likely to experience sideways movement in the coming days. The lack of strong momentum, decreasing volatility, and balanced volume suggest a period of consolidation. Traders may expect the stock price to trade within a narrow range without a clear trend direction. It is advisable to closely monitor key support and resistance levels for potential breakout opportunities.