Technical Analysis of SOXL 2024-05-10
Overview:
In analyzing the technical indicators for SOXL over the last 5 days, we will delve into the trend, momentum, volatility, and volume indicators to provide a comprehensive outlook on the possible stock price movement. By examining these key aspects, we aim to offer valuable insights and predictions for the upcoming days.
Trend Analysis:
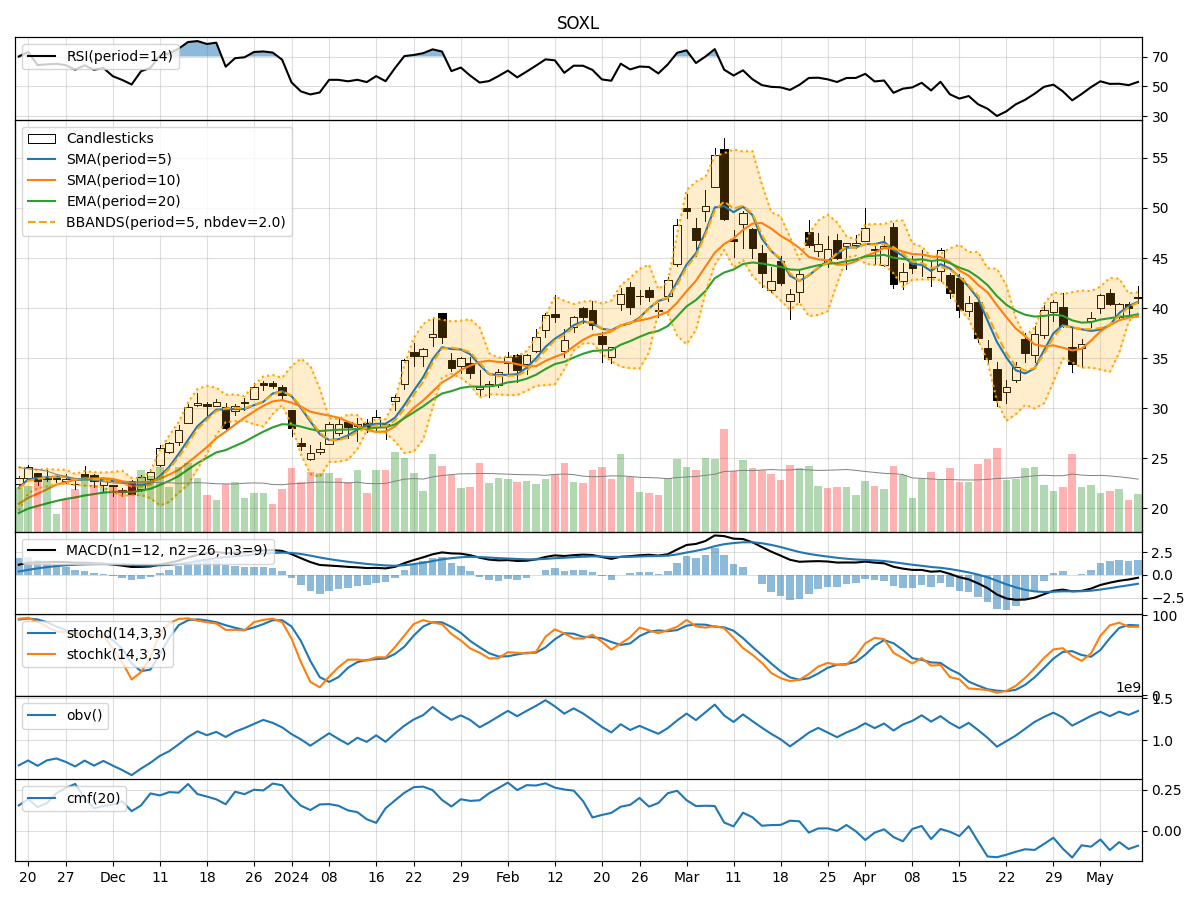
- Moving Averages (MA): The 5-day Moving Average (MA) has been consistently above the Simple Moving Average (SMA) and Exponential Moving Average (EMA), indicating a bullish trend.
- MACD: The MACD line has been above the signal line, with decreasing values, suggesting a potential slowdown in bullish momentum.
Momentum Analysis:
- RSI: The Relative Strength Index (RSI) has been fluctuating around the neutral zone, indicating indecision in the market.
- Stochastic Oscillator: Both %K and %D have been relatively high, signaling overbought conditions.
Volatility Analysis:
- Bollinger Bands (BB): The stock price has been trading within the Bollinger Bands, with the bands narrowing, suggesting a potential decrease in volatility.
- Bollinger Band Percentage (BBP): The BBP values have been fluctuating, indicating mixed market sentiment.
Volume Analysis:
- On-Balance Volume (OBV): The OBV has shown mixed movements, reflecting uncertainty in the buying and selling pressure.
- Chaikin Money Flow (CMF): The CMF has been negative, indicating a lack of strong buying pressure.
Key Observations and Opinions:
- Trend: The trend indicators suggest a bullish bias, but the decreasing MACD values may signal a potential reversal or consolidation.
- Momentum: The RSI and Stochastic Oscillator indicate mixed momentum, with overbought conditions, potentially leading to a pullback.
- Volatility: The narrowing Bollinger Bands and fluctuating BBP values point towards a decrease in volatility and possible consolidation.
- Volume: The OBV and CMF reflect a lack of strong buying pressure, contributing to the overall uncertainty in the market sentiment.
Conclusion:
Based on the analysis of the technical indicators, the next few days for SOXL could see sideways movement or a slight pullback in the stock price. The bullish trend may face resistance due to overbought conditions and decreasing momentum. Traders should exercise caution and closely monitor key support and resistance levels for potential entry or exit points.