Technical Analysis of SNPG 2024-05-10
Overview:
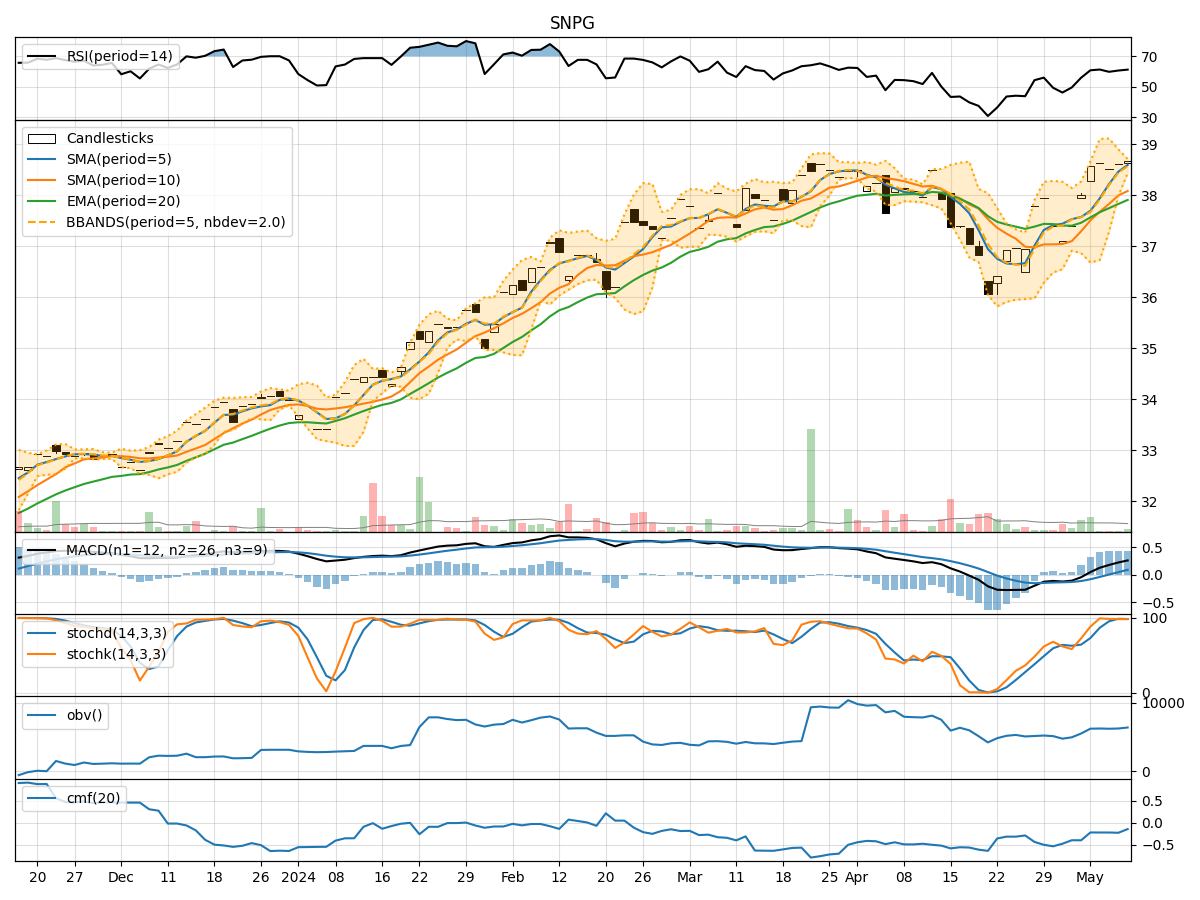
In analyzing the technical indicators for SNPG over the last 5 days, we will delve into the trend, momentum, volatility, and volume indicators to provide a comprehensive outlook on the possible stock price movement in the coming days.
Trend Analysis:
- Moving Averages (MA): The 5-day Moving Average (MA) has been consistently above the Simple Moving Average (SMA) and Exponential Moving Average (EMA), indicating a bullish trend.
- MACD: The MACD line has been above the signal line, with both lines showing an upward trend, suggesting bullish momentum.
Momentum Analysis:
- RSI: The Relative Strength Index (RSI) has been hovering around 60-61, indicating a neutral momentum.
- Stochastic Oscillator: Both %K and %D have been consistently high, suggesting strong buying pressure.
Volatility Analysis:
- Bollinger Bands (BB): The stock price has been trading within the upper Bollinger Band (BBU), indicating an overbought condition.
Volume Analysis:
- On-Balance Volume (OBV): The OBV has been fluctuating negatively, indicating distribution rather than accumulation.
- Chaikin Money Flow (CMF): The CMF has been consistently negative, reflecting selling pressure.
Key Observations:
- The trend indicators suggest a strong bullish sentiment in the short term.
- Momentum indicators show a neutral stance with slight bullish bias.
- Volatility indicators point towards an overbought condition.
- Volume indicators indicate a distribution phase rather than accumulation.
Conclusion:
Based on the analysis of the technical indicators, the stock price of SNPG is likely to experience a short-term upward movement driven by the bullish trend and momentum. However, caution is advised due to the overbought condition indicated by the Bollinger Bands and the negative volume indicators showing distribution. Traders should closely monitor the price action and consider taking profits or implementing risk management strategies as the stock may face resistance in the near future.