Technical Analysis of SNPE 2024-05-10
Overview:
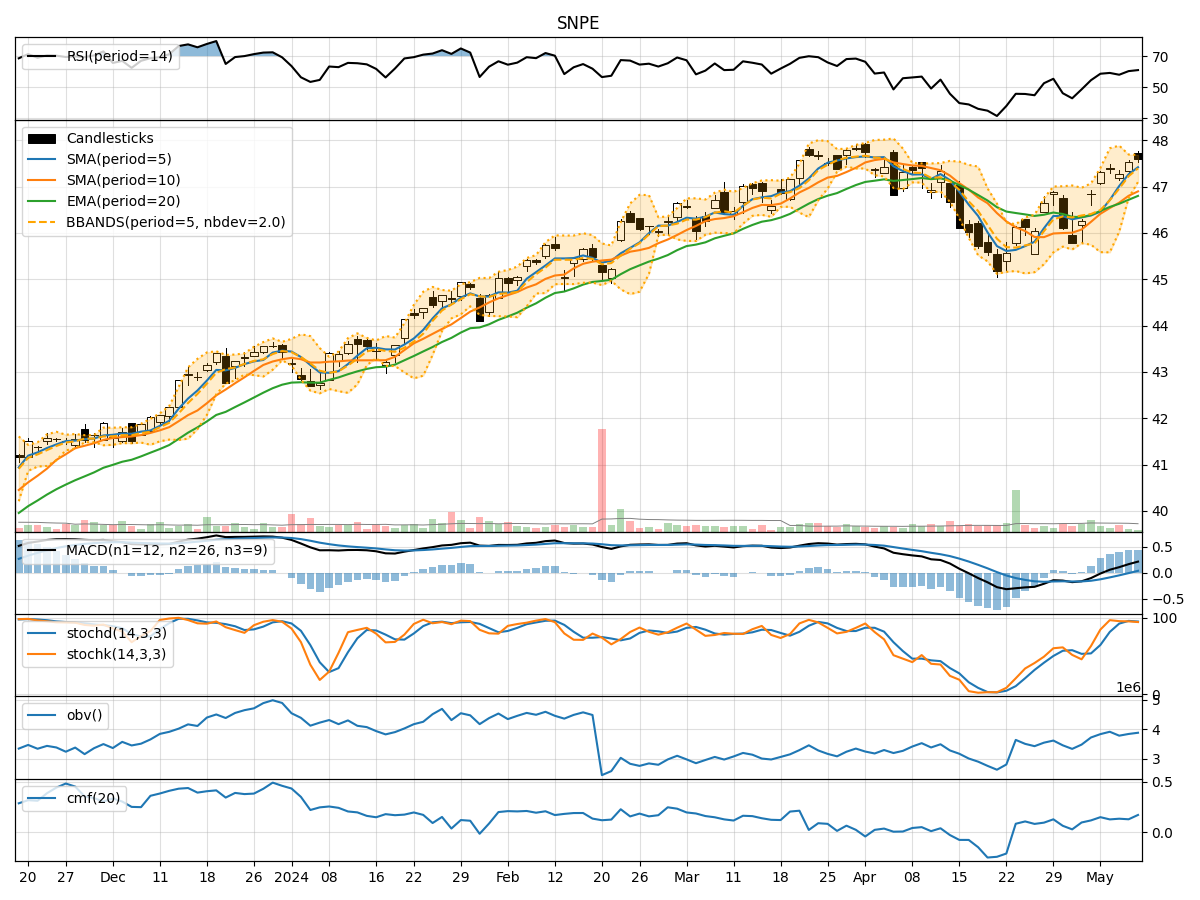
In analyzing the technical indicators for SNPE over the last 5 days, we will delve into the trend, momentum, volatility, and volume indicators to provide a comprehensive outlook on the possible stock price movement. By examining these key aspects, we aim to offer valuable insights and predictions for the upcoming days.
Trend Analysis:
- Moving Averages (MA): The 5-day Moving Average (MA) has been consistently trending upwards, indicating a bullish momentum in the short term.
- MACD: The MACD line has been above the signal line for the past few days, suggesting a positive trend in momentum.
- EMA: The Exponential Moving Average (EMA) has also been on an upward trajectory, supporting the bullish sentiment.
Momentum Analysis:
- RSI: The Relative Strength Index (RSI) has been in the overbought territory, indicating a strong buying momentum.
- Stochastic Oscillator: Both %K and %D have been at high levels, suggesting an overbought condition.
- Williams %R: The Williams %R is in the oversold region, signaling a potential reversal in the short term.
Volatility Analysis:
- Bollinger Bands: The Bollinger Bands have been narrowing, indicating decreasing volatility in the stock price.
- Bollinger %B: The %B indicator is hovering around 0.8, suggesting a relatively high price compared to the upper band.
Volume Analysis:
- On-Balance Volume (OBV): The OBV has been showing a slight decrease, indicating some distribution happening in the stock.
- Chaikin Money Flow (CMF): The CMF has been positive, reflecting buying pressure in the market.
Key Observations:
- The trend indicators suggest a bullish sentiment in the short term, supported by moving averages and MACD.
- Momentum indicators point towards overbought conditions, indicating a potential reversal or consolidation.
- Volatility has been decreasing, which may lead to a period of consolidation or a breakout.
- Volume indicators show a slight decrease in buying pressure, which could impact the stock price movement.
Conclusion:
Based on the analysis of the technical indicators, the next few days for SNPE could see a potential consolidation or a slight pullback in the stock price. The bullish trend may continue in the short term, but the overbought conditions and decreasing buying pressure suggest a possible correction or sideways movement. Traders should exercise caution and consider taking profits or implementing risk management strategies in the current market environment.