Technical Analysis of SMTH 2024-05-10
Overview:
In analyzing the technical indicators for the stock SMTH over the last 5 days, we will delve into the trends, momentum, volatility, and volume indicators to provide a comprehensive outlook on the possible future stock price movement. By examining these key aspects, we aim to offer valuable insights and recommendations for potential investors.
Trend Indicators:
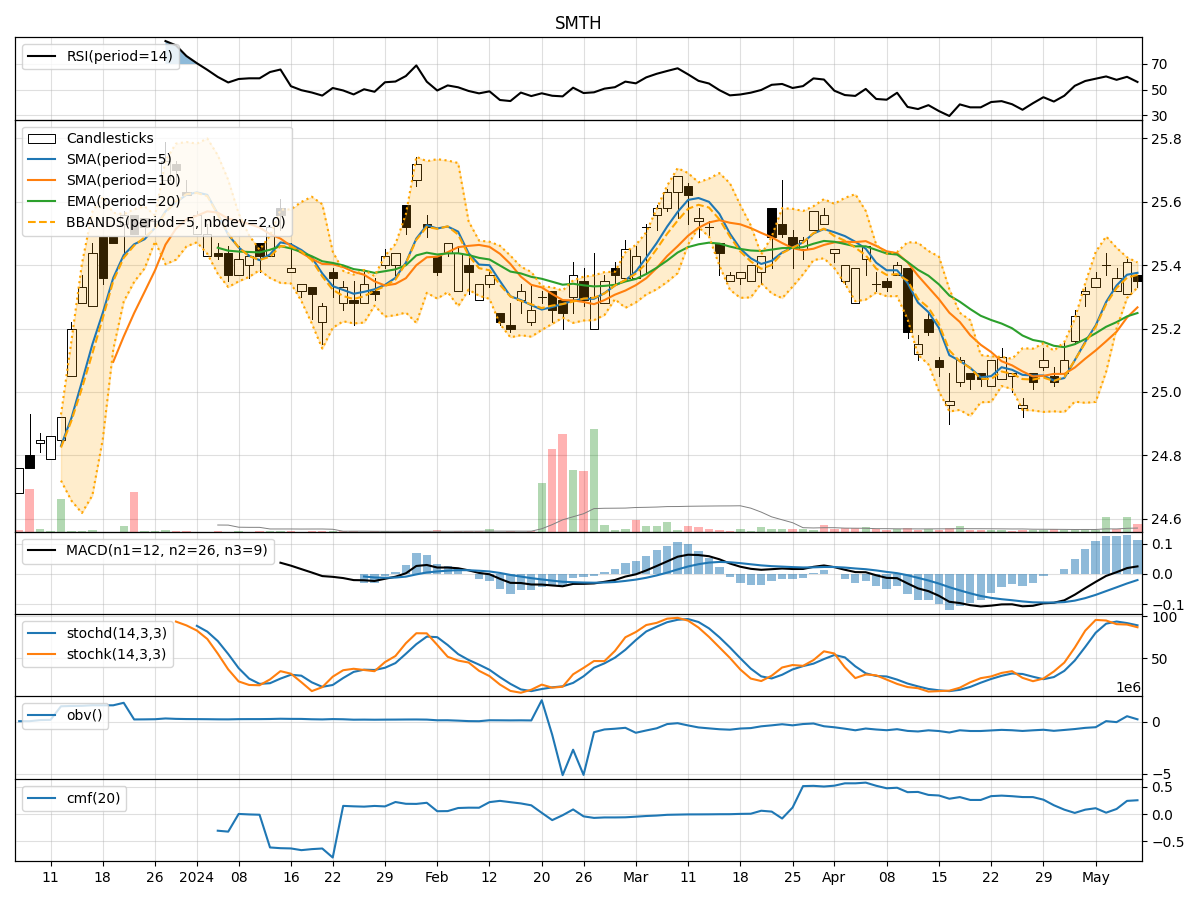
- Moving Averages (MA): The 5-day moving average (MA) has been consistently above the simple moving average (SMA) and exponential moving average (EMA), indicating a bullish trend.
- MACD: The MACD line has been consistently above the signal line, suggesting a bullish momentum in the stock price.
- MACD Histogram: The MACD histogram has been showing positive values, further supporting the bullish sentiment in the stock.
Momentum Indicators:
- RSI: The Relative Strength Index (RSI) has been fluctuating around the 50 level, indicating a neutral momentum in the stock.
- Stochastic Oscillator: Both %K and %D lines of the stochastic oscillator have been trending downwards, signaling a potential bearish momentum.
- Williams %R: The Williams %R indicator has been consistently in the oversold territory, suggesting a bearish sentiment.
Volatility Indicators:
- Bollinger Bands: The stock price has been trading within the Bollinger Bands, with the bands narrowing, indicating decreasing volatility.
- Bollinger %B: The %B indicator has been hovering around the middle range, reflecting a neutral volatility sentiment.
Volume Indicators:
- On-Balance Volume (OBV): The OBV indicator has shown mixed signals, with fluctuations in volume accumulation, indicating indecision in the market.
- Chaikin Money Flow (CMF): The CMF has been positive, suggesting buying pressure in the stock.
Conclusion:
Based on the analysis of the technical indicators, the stock SMTH is currently exhibiting a mixed outlook. While the trend indicators suggest a bullish sentiment, the momentum indicators point towards a potential bearish momentum. The volatility indicators indicate decreasing volatility, while the volume indicators show indecision in the market.
Overall Assessment:
- Trend: Upward
- Momentum: Downward
- Volatility: Consolidation
- Volume: Indecisive
Recommendation:
Considering the conflicting signals from the different indicators, it is advisable for investors to exercise caution and closely monitor the stock SMTH in the coming days. It is recommended to wait for more clarity in the market dynamics before making any significant trading decisions.