Technical Analysis of SMI 2024-05-10
Overview:
In analyzing the technical indicators for SMI stock over the last 5 days, we will delve into the trends, momentum, volatility, and volume indicators to provide a comprehensive outlook on the possible stock price movement in the coming days. By examining these key aspects, we aim to offer valuable insights and predictions for informed decision-making.
Trend Indicators:
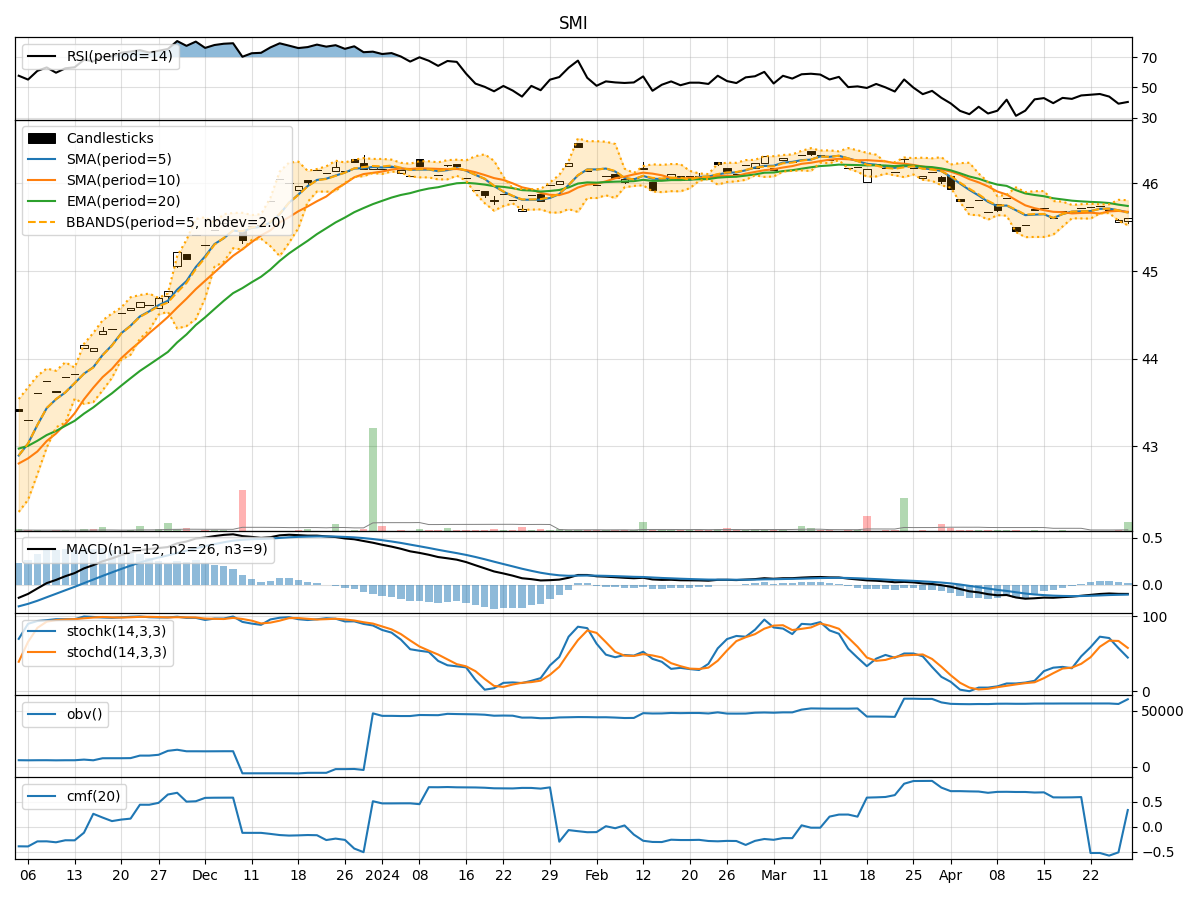
- Moving Averages (MA): The 5-day Moving Average (MA) has been consistently above the Simple Moving Average (SMA) and Exponential Moving Average (EMA), indicating a bullish trend.
- MACD: The Moving Average Convergence Divergence (MACD) has shown positive values, with the MACD line consistently above the signal line, suggesting upward momentum.
Momentum Indicators:
- RSI: The Relative Strength Index (RSI) has been in the range of 50-70, indicating a moderate bullish momentum.
- Stochastic Oscillator: Both %K and %D have been in the overbought zone, suggesting a potential reversal or consolidation.
Volatility Indicators:
- Bollinger Bands (BB): The stock price has mostly stayed within the Bollinger Bands, with the bands narrowing, indicating decreasing volatility.
Volume Indicators:
- On-Balance Volume (OBV): The OBV has shown a slight increase, reflecting positive volume flow.
- Chaikin Money Flow (CMF): The CMF has been consistently positive, indicating buying pressure.
Key Observations:
- The trend indicators suggest a bullish sentiment, supported by the moving averages and MACD.
- Momentum indicators show a moderate bullish momentum but with signs of potential overbought conditions.
- Volatility has been decreasing, indicating a possible period of consolidation.
- Volume indicators reflect positive volume flow and buying pressure.
Conclusion:
Based on the analysis of the technical indicators, the stock price is likely to continue its upward trend in the short term. However, caution is advised as the momentum indicators show signs of potential overbought conditions, which could lead to a temporary pullback or consolidation. Traders should closely monitor the stochastic oscillator for potential reversal signals. Overall, the outlook remains bullish with a possibility of short-term consolidation before further upside movement.