Technical Analysis of SKYY 2024-05-10
Overview:
In analyzing the technical indicators for SKYY over the last 5 days, we will delve into the trend, momentum, volatility, and volume indicators to provide a comprehensive outlook on the possible stock price movement in the coming days. By examining these key indicators, we aim to offer valuable insights and predictions for informed decision-making.
Trend Indicators:
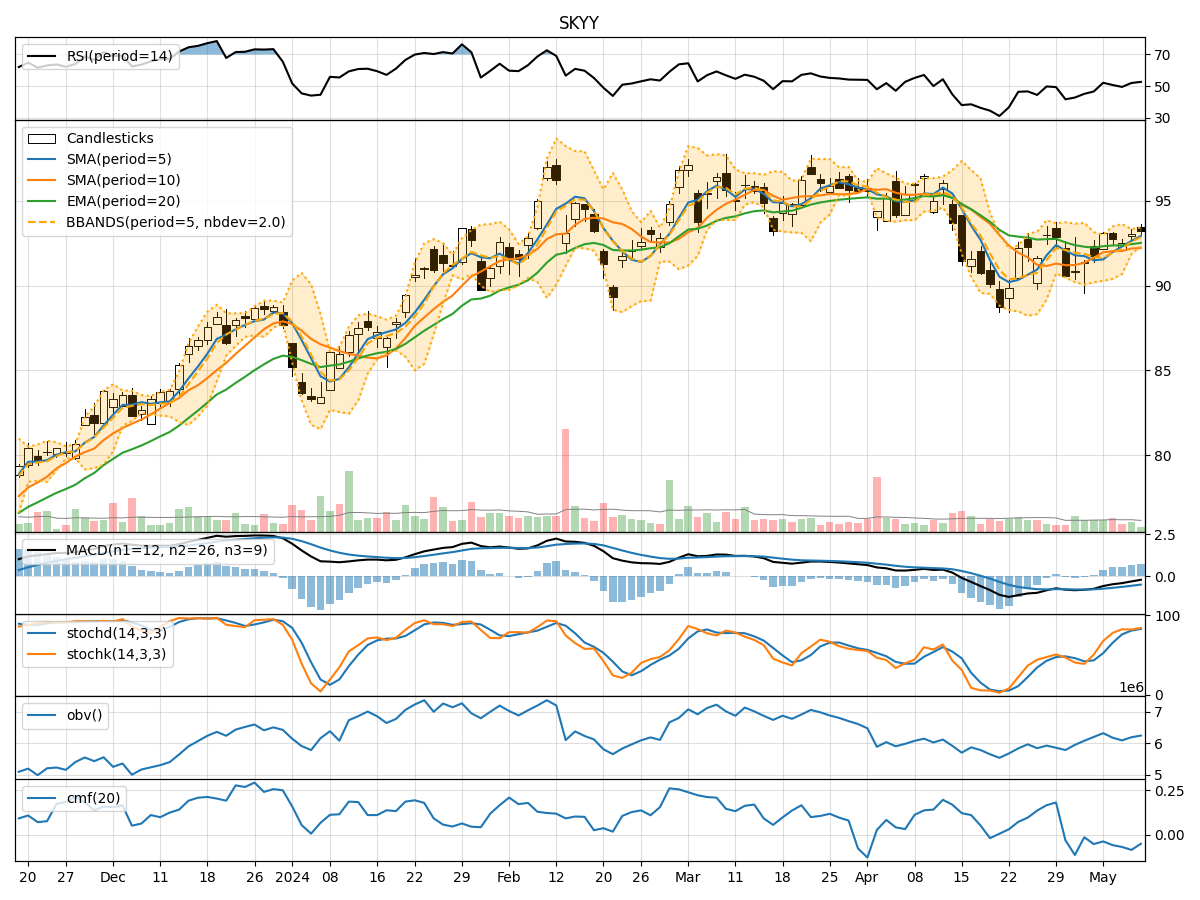
- Moving Averages (MA): The 5-day Moving Average (MA) has been consistently above the Simple Moving Average (SMA) and Exponential Moving Average (EMA), indicating a short-term bullish trend.
- MACD: The Moving Average Convergence Divergence (MACD) has shown a positive trend with the MACD line consistently above the signal line, suggesting bullish momentum.
- MACD Histogram: The MACD Histogram has been increasing, indicating strengthening bullish momentum.
Momentum Indicators:
- RSI: The Relative Strength Index (RSI) has been fluctuating around the neutral level of 50, indicating a balanced momentum.
- Stochastic Oscillator: Both %K and %D of the Stochastic Oscillator have been in the overbought zone, suggesting a potential reversal or consolidation.
- Williams %R: The Williams %R is hovering in the oversold territory, indicating a possible buying opportunity.
Volatility Indicators:
- Bollinger Bands: The Bollinger Bands have been narrowing, suggesting decreasing volatility and a potential price breakout in the near future.
- Bollinger %B: The %B indicator is relatively stable, indicating a period of consolidation.
- Bollinger Band Width: The Band Width has been decreasing, signaling a potential decrease in volatility.
Volume Indicators:
- On-Balance Volume (OBV): The OBV has shown a declining trend, indicating selling pressure in the stock.
- Chaikin Money Flow (CMF): The CMF has been negative, suggesting outflow of money from the stock.
Key Observations and Opinions:
- Trend: The trend indicators suggest a bullish bias in the short term.
- Momentum: Momentum indicators show mixed signals with a potential for a reversal or consolidation.
- Volatility: Volatility indicators point towards a period of consolidation and a potential breakout.
- Volume: Volume indicators indicate selling pressure and a negative money flow.
Conclusion:
Based on the analysis of the technical indicators, the next few days' possible stock price movement for SKYY is likely to experience a period of consolidation with a potential for a bullish breakout. Traders should closely monitor key levels and wait for confirmation of a clear trend direction before making trading decisions. Exercise caution and wait for a clear signal before taking any significant positions.