Technical Analysis of SKYU 2024-05-10
Overview:
In analyzing the technical indicators for SKYU stock over the last 5 days, we will delve into the trend, momentum, volatility, and volume indicators to provide a comprehensive outlook on the possible future stock price movement. By examining these key indicators, we aim to offer valuable insights and recommendations for potential investors.
Trend Indicators:
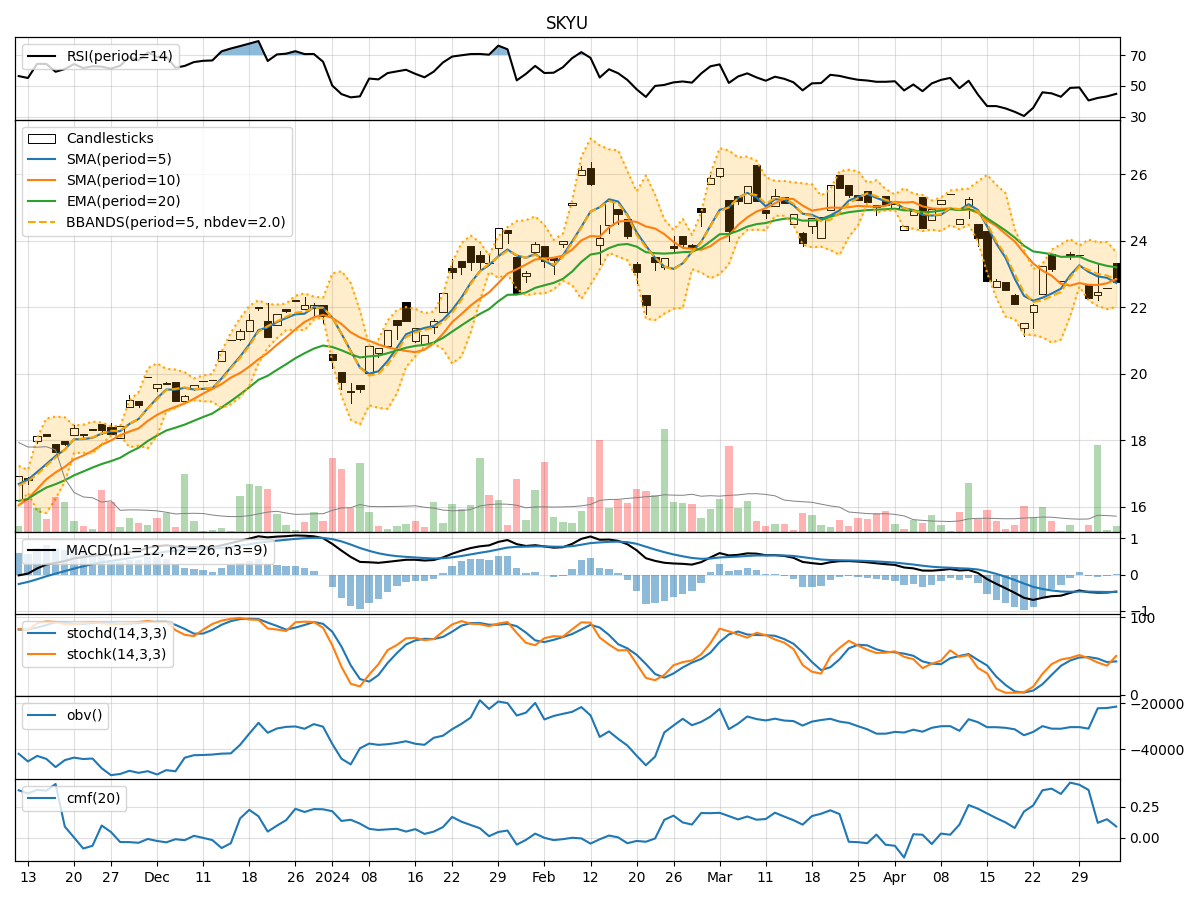
- Moving Averages (MA): The 5-day moving average has been consistently above the simple moving average (SMA) and exponential moving average (EMA), indicating a short-term uptrend.
- MACD: The MACD line has been negative but converging towards the signal line, suggesting a potential reversal in the downtrend.
- MACD Histogram: The histogram has been decreasing but showing signs of stabilization, hinting at a possible trend reversal.
Momentum Indicators:
- RSI: The Relative Strength Index (RSI) has been fluctuating around the neutral level of 50, indicating a lack of strong momentum in either direction.
- Stochastic Oscillator: Both %K and %D have been in overbought territory, suggesting a potential pullback in the stock price.
- Williams %R: The Williams %R is in oversold territory, indicating a possible reversal to the upside.
Volatility Indicators:
- Bollinger Bands: The stock price has been trading within the Bollinger Bands, with the bands narrowing, signaling a period of consolidation.
- Bollinger %B: The %B indicator is hovering around the midpoint, indicating a balanced market sentiment.
- Average True Range (ATR): The ATR has been relatively stable, suggesting a lack of significant price fluctuations.
Volume Indicators:
- On-Balance Volume (OBV): The OBV has been fluctuating but showing a slight decline, indicating some distribution of shares.
- Chaikin Money Flow (CMF): The CMF has been positive but trending downwards, suggesting weakening buying pressure.
Conclusion:
Based on the analysis of the technical indicators, the stock price of SKYU is likely to experience sideways movement in the near term. The trend indicators point towards a potential reversal in the downtrend, while momentum indicators suggest a lack of strong buying or selling pressure. Volatility indicators indicate a period of consolidation, and volume indicators show a mixed sentiment with a slight bias towards distribution.
Therefore, it is recommended to exercise caution and closely monitor the price action for any signs of a breakout or trend confirmation before making any trading decisions.