Technical Analysis of SKOR 2024-05-10
Overview:
In analyzing the technical indicators for SKOR over the last 5 days, we will delve into the trend, momentum, volatility, and volume indicators to provide a comprehensive outlook on the possible stock price movement in the coming days. By examining these key indicators, we aim to offer valuable insights and predictions for potential investors.
Trend Indicators:
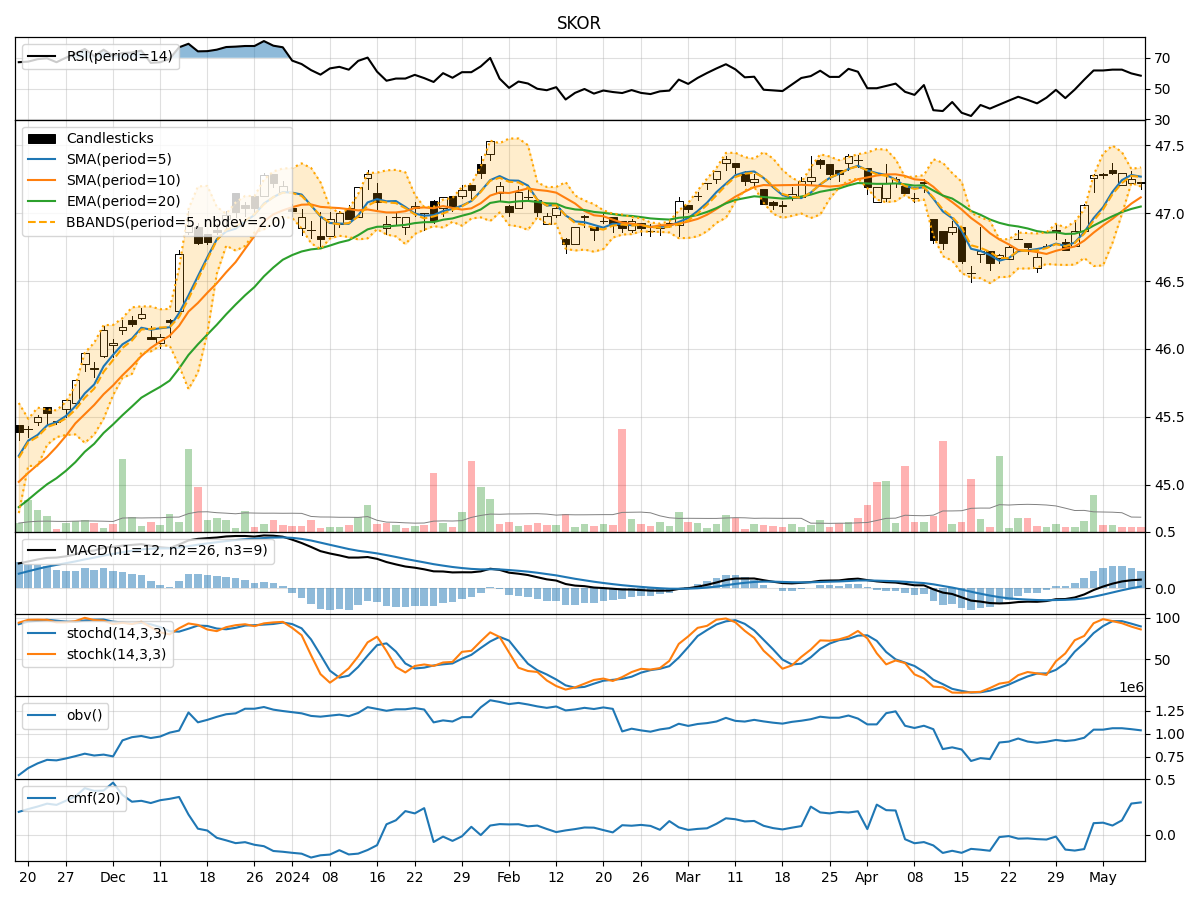
- Moving Averages (MA): The 5-day Moving Average (MA) has been consistently above the closing prices, indicating a bullish trend.
- MACD: The Moving Average Convergence Divergence (MACD) has shown positive values, suggesting a bullish momentum.
- EMA: The Exponential Moving Average (EMA) has been trending upwards, supporting the bullish sentiment.
Momentum Indicators:
- RSI: The Relative Strength Index (RSI) has been fluctuating around the neutral zone, indicating a lack of strong momentum.
- Stochastic Oscillator: Both %K and %D have been decreasing, signaling a potential bearish momentum.
- Williams %R: The Williams %R is in the oversold territory, suggesting a possible reversal.
Volatility Indicators:
- Bollinger Bands (BB): The Bollinger Bands have been narrowing, indicating decreasing volatility.
- BB%: The %B indicator has been hovering around the middle, suggesting a neutral stance on volatility.
Volume Indicators:
- On-Balance Volume (OBV): The OBV has been declining, indicating selling pressure.
- Chaikin Money Flow (CMF): The CMF has been positive, suggesting accumulation.
Key Observations:
- The trend indicators point towards a bullish sentiment with moving averages and MACD supporting upward momentum.
- Momentum indicators show mixed signals with RSI neutral, Stochastic indicating a bearish bias, and Williams %R in the oversold region.
- Volatility has been decreasing as per Bollinger Bands, indicating a potential consolidation phase.
- Volume indicators suggest selling pressure based on OBV, while CMF indicates accumulation.
Conclusion:
Based on the analysis of the technical indicators, the stock price of SKOR is likely to experience a period of consolidation in the coming days. The bullish trend indicated by moving averages and MACD may face resistance due to the mixed momentum signals and decreasing volatility. Investors should exercise caution and monitor the price action closely for potential entry or exit points. Overall, the outlook is neutral with a slight bearish bias.