Technical Analysis of SIXJ 2024-05-10
Overview:
In analyzing the technical indicators for SIXJ over the last 5 days, we will delve into the trend, momentum, volatility, and volume indicators to provide a comprehensive outlook on the possible stock price movement. By examining these key aspects, we aim to offer valuable insights and predictions for the upcoming trading days.
Trend Analysis:
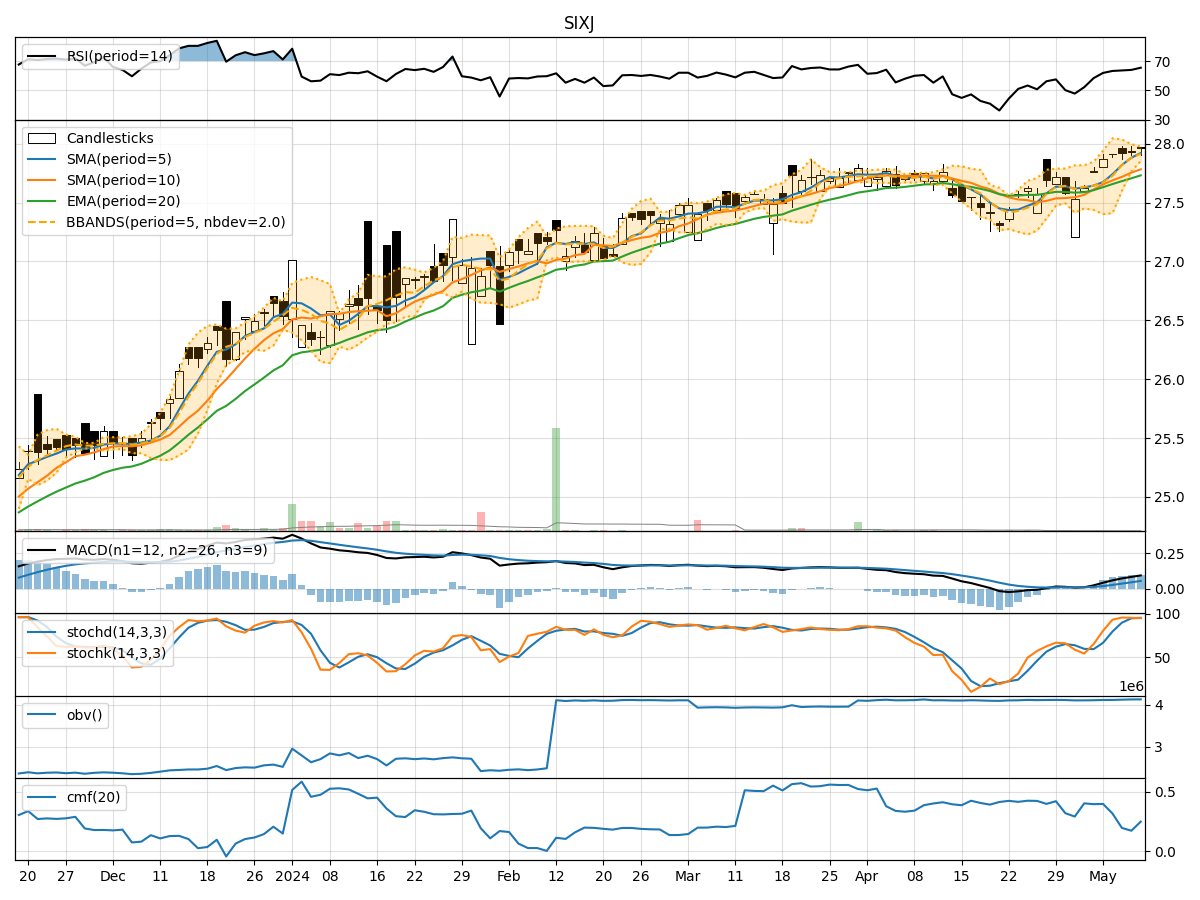
- Moving Averages (MA): The moving averages show a consistent uptrend with the closing price consistently above the short-term moving averages.
- MACD: The MACD line has been consistently above the signal line, indicating a bullish trend.
- RSI: The RSI values have been in the overbought territory, suggesting a strong bullish momentum.
Key Observation: The trend indicators suggest a strong bullish sentiment in the stock price movement.
Momentum Analysis:
- Stochastic Oscillator: Both %K and %D values have been consistently high, indicating strong buying momentum.
- Williams %R: The Williams %R values have been consistently in the oversold territory, signaling a strong bullish momentum.
Key Observation: The momentum indicators reinforce the bullish sentiment in the stock price movement.
Volatility Analysis:
- Bollinger Bands: The stock price has been trading within the upper Bollinger Band, indicating high volatility.
- Volatility Bands: The volatility bands show a narrowing range, suggesting a potential decrease in volatility.
Key Observation: The volatility indicators point towards high volatility in the stock price movement, with a possible decrease in volatility in the near term.
Volume Analysis:
- On-Balance Volume (OBV): The OBV values have been steadily increasing, indicating strong buying pressure.
- Chaikin Money Flow (CMF): The CMF values have been positive, reflecting a bullish money flow trend.
Key Observation: The volume indicators support the bullish sentiment in the stock price movement.
Conclusion:
Based on the analysis of the trend, momentum, volatility, and volume indicators, the overall outlook for SIXJ is strongly bullish. The stock is likely to continue its upward trajectory in the coming days, supported by the positive trend and momentum indicators, along with strong buying pressure indicated by volume indicators. Traders and investors may consider taking long positions or holding onto existing positions to capitalize on the expected upward movement in the stock price.
Key Conclusion: Upward movement is highly probable in the next few days for SIXJ based on the technical analysis provided.