Technical Analysis of SIXH 2024-05-10
Overview:
In analyzing the technical indicators for SIXH over the last 5 days, we will delve into the trend, momentum, volatility, and volume indicators to provide a comprehensive outlook on the possible stock price movement in the coming days. By examining these key aspects, we aim to offer valuable insights and predictions for potential investors.
Trend Analysis:
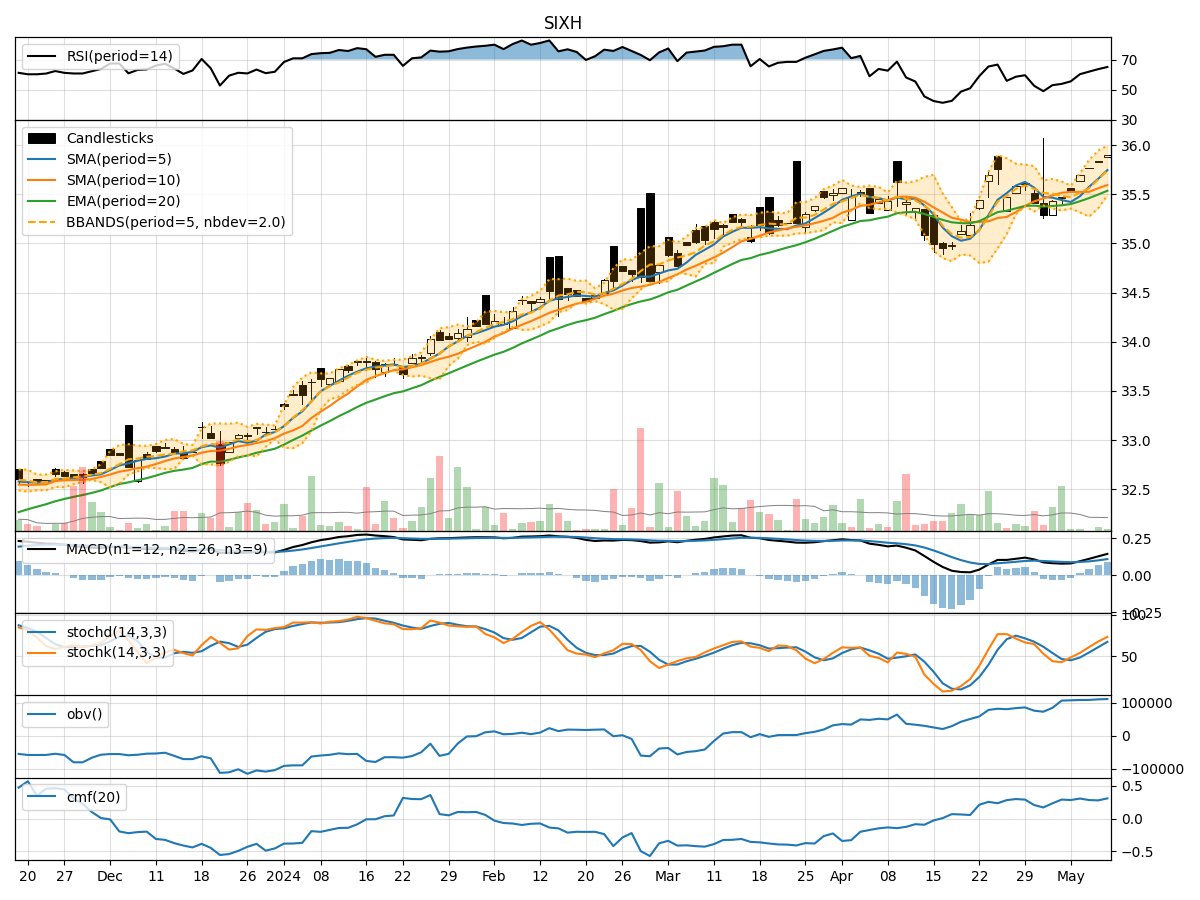
- Moving Averages (MA): The moving averages show a consistent uptrend with the closing price consistently above the short-term moving averages.
- MACD: The MACD line has been consistently positive, indicating a bullish momentum in the stock.
- EMA: The exponential moving average has been trending upwards, reflecting a positive sentiment in the stock price.
Key Observation: The trend indicators suggest a strong bullish trend in SIXH.
Momentum Analysis:
- RSI: The Relative Strength Index has been gradually increasing, indicating strengthening buying momentum.
- Stochastic Oscillator: Both %K and %D lines of the Stochastic Oscillator are in the overbought zone, suggesting a potential reversal or consolidation.
- Williams %R: The Williams %R is in the oversold territory, indicating a potential buying opportunity.
Key Observation: Momentum indicators show mixed signals with a possibility of a short-term correction or consolidation.
Volatility Analysis:
- Bollinger Bands: The Bollinger Bands have been widening, indicating increased volatility in the stock price.
- Bollinger %B: The %B indicator is below 1, suggesting the stock is trading below the upper Bollinger Band.
Key Observation: Volatility indicators point towards heightened price fluctuations in SIXH.
Volume Analysis:
- On-Balance Volume (OBV): The OBV has been steadily increasing, indicating strong buying pressure.
- Chaikin Money Flow (CMF): The CMF is positive, reflecting a healthy inflow of money into the stock.
Key Observation: Volume indicators support the bullish sentiment in SIXH.
Conclusion:
Based on the analysis of the technical indicators, SIXH is currently in a strong bullish trend supported by positive momentum and volume indicators. However, the overbought signals from the Stochastic Oscillator and potential volatility as indicated by the Bollinger Bands suggest a possible short-term correction or consolidation in the stock price.
Recommendation: Investors should consider taking profits if holding a long position and wait for a potential dip to re-enter or initiate new positions. Short-term traders may look for opportunities to capitalize on the expected correction. Overall, the mid-to-long-term outlook remains bullish for SIXH.