Technical Analysis of SIXF 2024-05-10
Overview:
In analyzing the technical indicators for SIXF over the last 5 days, we will delve into the trend, momentum, volatility, and volume indicators to provide a comprehensive outlook on the possible stock price movement in the coming days. By examining these key aspects, we aim to offer valuable insights and recommendations for potential investors.
Trend Indicators:
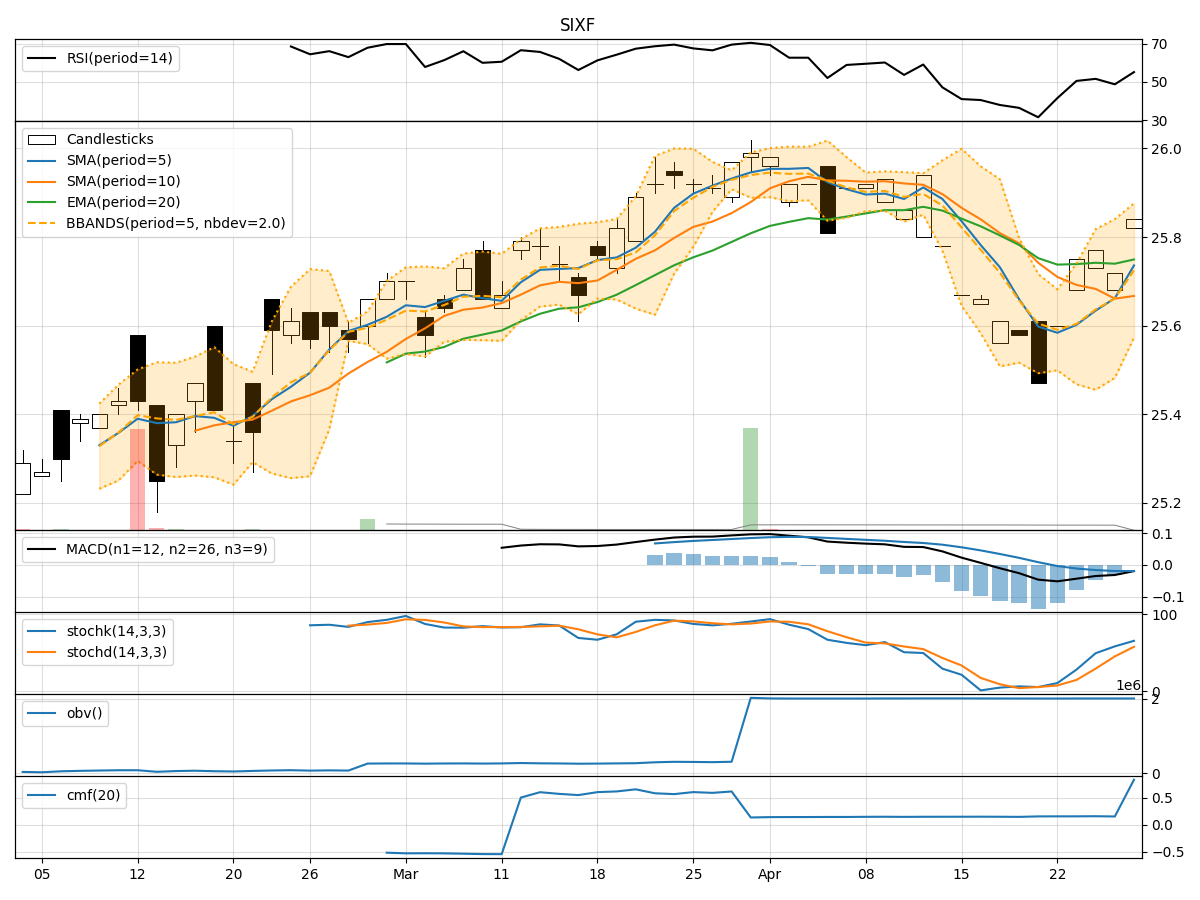
- Moving Averages (MA): The moving averages have been showing a consistent uptrend, with the 5-day MA consistently above the 10-day SMA and 20-day EMA. This indicates a positive trend in the stock price.
- MACD: The MACD line has been consistently above the signal line, indicating bullish momentum in the stock.
- MACD Histogram: The MACD histogram has been increasing, suggesting strengthening bullish momentum in the stock.
Momentum Indicators:
- RSI: The RSI has been gradually increasing, indicating strengthening buying momentum in the stock.
- Stochastic Oscillator: Both %K and %D have been at 100%, signaling overbought conditions but also strong upward momentum.
- Williams %R: The Williams %R has consistently been at 0, indicating the stock has been oversold.
Volatility Indicators:
- Bollinger Bands (BB): The stock price has been consistently trading above the middle Bollinger Band, indicating an upward trend with low volatility.
- Bollinger Band Width: The Bollinger Band width has been narrowing, suggesting decreasing volatility in the stock price.
Volume Indicators:
- On-Balance Volume (OBV): The OBV has been steadily increasing, indicating strong buying volume in the stock.
- Chaikin Money Flow (CMF): The CMF has been positive, indicating that money is flowing into the stock.
Key Observations and Opinions:
- Trend: The stock is in a strong uptrend based on moving averages and MACD analysis.
- Momentum: Momentum indicators suggest strong buying momentum, but the stock is currently overbought.
- Volatility: Volatility has been decreasing, indicating a potential period of consolidation.
- Volume: Strong buying volume is supporting the uptrend in the stock.
Conclusion:
Based on the analysis of the technical indicators, the next few days' possible stock price movement for SIXF is likely to continue in an upward direction. The stock shows strong bullish momentum, supported by increasing buying volume and a positive trend in moving averages and MACD. However, caution should be exercised as the stock is currently overbought, and a period of consolidation or a minor pullback may occur before further upside movement. Investors should monitor the stock closely for any signs of reversal or continuation of the current uptrend.