Technical Analysis of SHYG 2024-05-10
Overview:
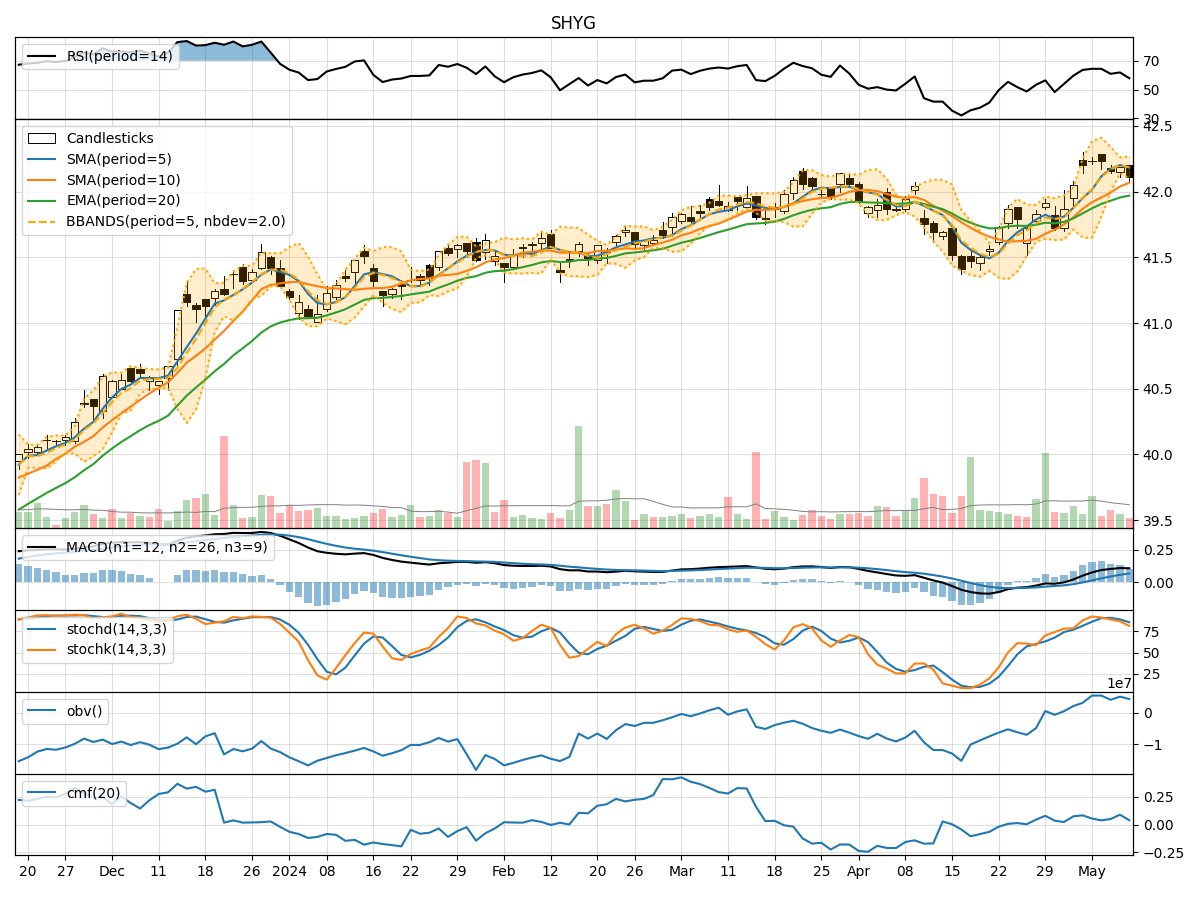
In analyzing the technical indicators for SHYG over the last 5 days, we will delve into the trend, momentum, volatility, and volume indicators to provide a comprehensive outlook on the possible stock price movement. By examining these key aspects, we aim to offer valuable insights and predictions for the upcoming trading days.
Trend Analysis:
- Moving Averages (MA): The 5-day Moving Average (MA) has been consistently above the Simple Moving Average (SMA) and Exponential Moving Average (EMA), indicating a bullish trend.
- MACD: The MACD line has been consistently above the signal line, with both lines showing an upward trend, suggesting bullish momentum.
- RSI: The Relative Strength Index (RSI) has been fluctuating around the overbought territory, indicating strong buying pressure.
Momentum Analysis:
- Stochastic Oscillator: The Stochastic Oscillator has been gradually decreasing but remains in the overbought zone, signaling a potential reversal.
- Williams %R: The Williams %R indicator has been consistently in the oversold territory, suggesting a bearish sentiment.
Volatility Analysis:
- Bollinger Bands: The Bollinger Bands have been narrowing, indicating decreasing volatility and a potential upcoming price breakout.
- Average True Range (ATR): The ATR has been relatively stable, suggesting consistent price movements.
Volume Analysis:
- On-Balance Volume (OBV): The OBV has shown mixed signals, with fluctuations in volume accumulation.
- Chaikin Money Flow (CMF): The CMF has been positive but fluctuating, indicating some uncertainty in the buying pressure.
Conclusion:
Based on the analysis of the technical indicators, the stock price of SHYG is likely to experience sideways consolidation in the next few days. The bullish trend indicated by moving averages and MACD may face resistance due to the overbought conditions highlighted by the RSI and Stochastic Oscillator. The narrowing Bollinger Bands suggest a potential breakout, but the mixed volume signals imply a lack of strong conviction in the market direction. Therefore, it is advisable to exercise caution and closely monitor the price action for any potential reversals or breakout opportunities.