Technical Analysis of SHYD 2024-05-10
Overview:
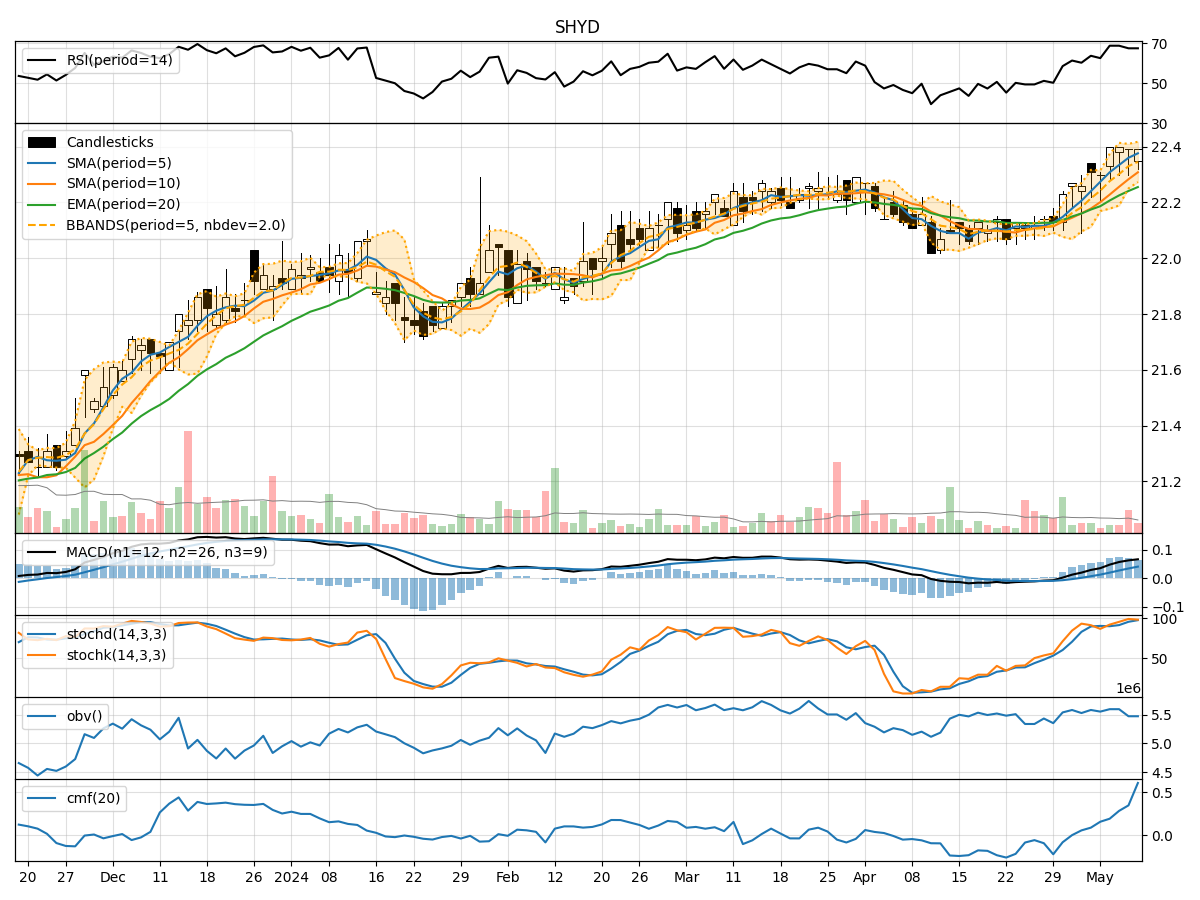
In analyzing the technical indicators for SHYD over the last 5 days, we will delve into the trends, momentum, volatility, and volume indicators to provide a comprehensive outlook on the possible stock price movement. By examining these key aspects, we aim to offer valuable insights and predictions for the upcoming days.
Trend Indicators:
- Moving Averages (MA): The 5-day MA has been consistently above the closing price, indicating a short-term uptrend.
- MACD: The MACD line has been positive and increasing, suggesting bullish momentum.
- EMA: The EMA has been trending upwards, supporting the bullish sentiment.
Key Observation: The trend indicators point towards a bullish outlook for SHYD.
Momentum Indicators:
- RSI: The RSI has been in the overbought territory, indicating strong buying momentum.
- Stochastic Oscillator: Both %K and %D have been in the overbought zone, signaling potential for a pullback.
- Williams %R: The indicator has been in the oversold region, suggesting a possible reversal.
Key Observation: Momentum indicators show a mixed signal with potential for a short-term correction.
Volatility Indicators:
- Bollinger Bands (BB): The bands have been widening, indicating increased volatility.
- BB %B: The %B has been fluctuating within the bands, reflecting volatility in price movements.
Key Observation: Volatility is increasing, which may lead to larger price swings in the near term.
Volume Indicators:
- On-Balance Volume (OBV): The OBV has been relatively stable, suggesting consistent buying pressure.
- Chaikin Money Flow (CMF): The CMF has been positive, indicating money flow into the stock.
Key Observation: Volume indicators support the bullish sentiment with steady accumulation.
Conclusion:
Based on the analysis of trend, momentum, volatility, and volume indicators, the overall outlook for SHYD suggests a bullish bias in the short term. While momentum indicators hint at a potential correction, the strong trend and volume support the upward movement. The increasing volatility may lead to some price fluctuations, but the overall trend remains positive.
Recommendation:
Considering the technical indicators and the current market dynamics, it is advisable to consider buying opportunities on potential dips or pullbacks for SHYD. Traders should closely monitor the momentum indicators for signs of a reversal, while investors can capitalize on the bullish trend for potential gains in the coming days.