Technical Analysis of SHAG 2024-05-10
Overview:
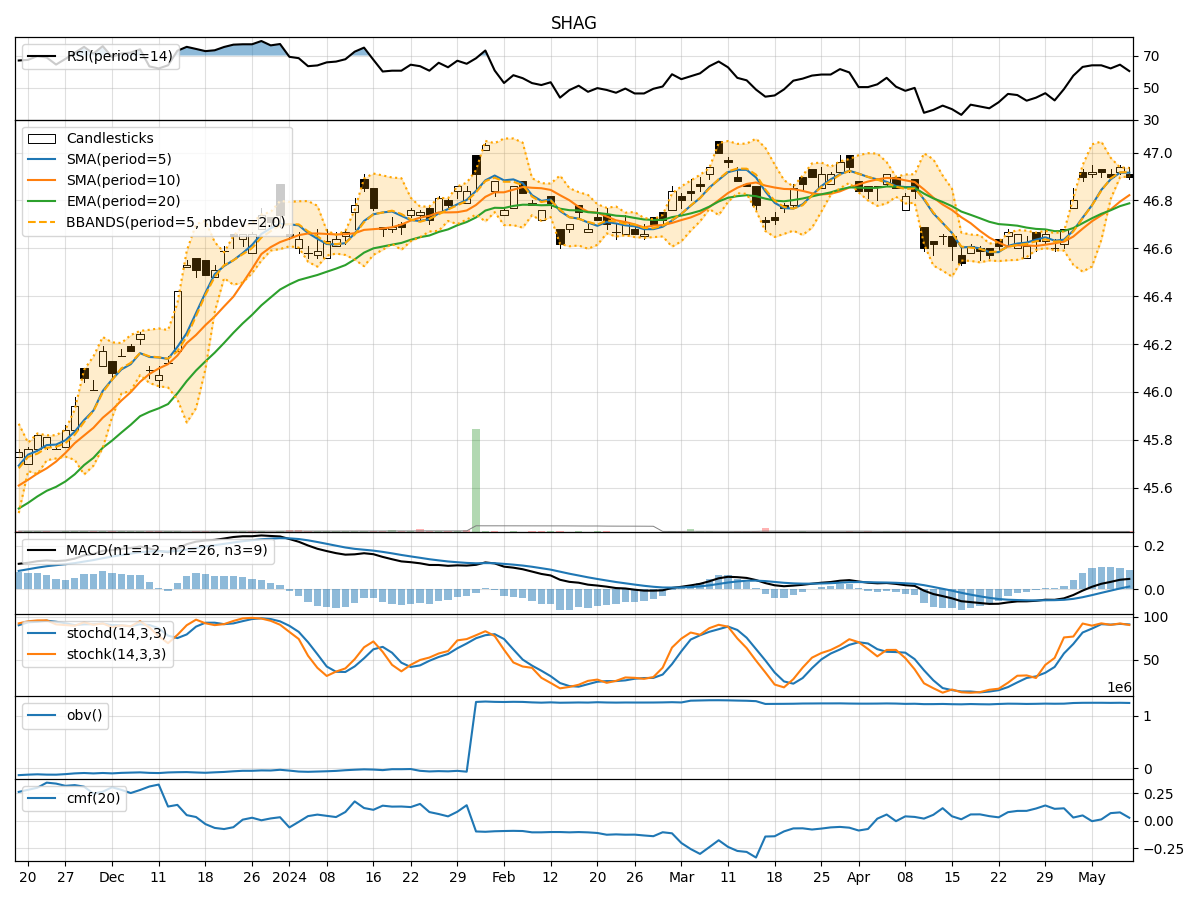
In the last 5 trading days, SHAG stock has shown relatively stable price movements with minor fluctuations. The trend indicators suggest a slight uptrend, supported by the moving averages and MACD. Momentum indicators indicate a neutral to slightly bullish sentiment, with RSI hovering around the mid-range. Volatility indicators show a narrowing of the Bollinger Bands, indicating decreasing price volatility. Volume indicators suggest mixed trading activity, with OBV showing some divergence.
Trend Indicators:
- Moving Averages (MA): The 5-day MA is slightly above the 10-day SMA, indicating a short-term uptrend.
- MACD: The MACD line is above the signal line, suggesting bullish momentum.
- EMA: The EMA is trending upwards, supporting the bullish sentiment.
Momentum Indicators:
- RSI: The RSI is in the neutral zone, indicating neither overbought nor oversold conditions.
- Stochastic Oscillator: Both %K and %D are in the overbought territory, suggesting potential for a pullback.
- Williams %R: The indicator is in the oversold region, indicating a possible reversal.
Volatility Indicators:
- Bollinger Bands: The bands are narrowing, suggesting decreasing volatility and a potential breakout.
- Bollinger %B: The %B is below 1, indicating the price is below the upper band.
Volume Indicators:
- On-Balance Volume (OBV): The OBV has shown mixed signals, with some divergence in the recent trading sessions.
- Chaikin Money Flow (CMF): The CMF is positive, indicating buying pressure.
Conclusion:
Based on the analysis of the technical indicators, the next few days for SHAG stock could see sideways consolidation with a slight bullish bias. The trend indicators support a potential continuation of the uptrend, while momentum indicators suggest a possible pullback before resuming the upward movement. Volatility indicators point towards a period of decreased volatility, possibly before a breakout. Volume indicators indicate mixed trading activity, which may lead to choppy price movements.
Overall, the stock is likely to consolidate in the near term with a potential for a bullish breakout. Traders should watch for key support and resistance levels for confirmation of the next directional move.