Technical Analysis of SH 2024-05-10
Overview:
In analyzing the technical indicators for SH stock over the last 5 days, we will delve into the trend, momentum, volatility, and volume indicators to provide a comprehensive outlook on the possible stock price movement in the coming days. By examining these key indicators, we aim to offer valuable insights and predictions to guide investment decisions.
Trend Analysis:
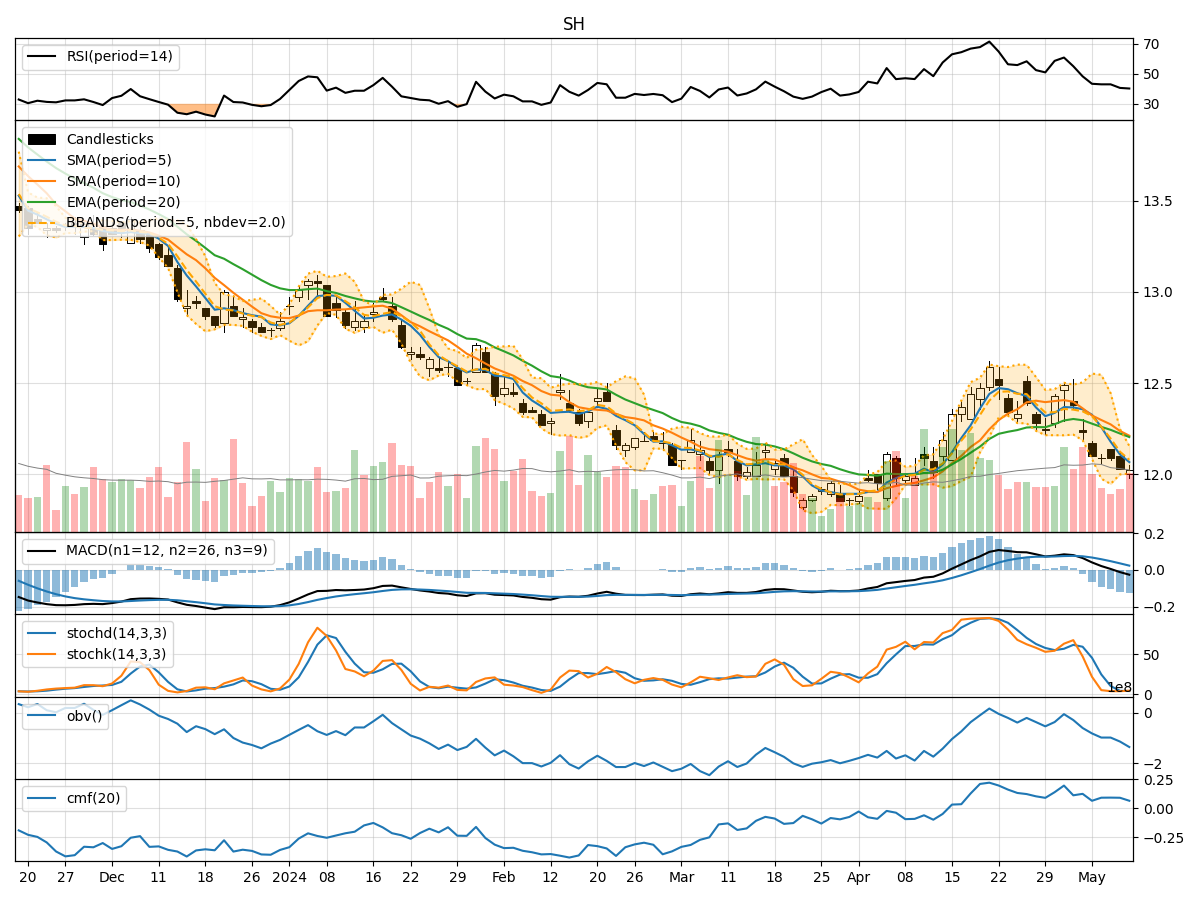
- Moving Averages (MA): The 5-day MA has been consistently below the closing price, indicating a short-term downtrend.
- MACD: The MACD line has been decreasing, with the MACD histogram also showing a downward trend, suggesting weakening momentum.
- EMA: The EMA has been declining, further supporting the bearish trend.
Momentum Analysis:
- RSI: The RSI has been decreasing, indicating a loss in bullish momentum.
- Stochastic Oscillator: Both %K and %D have been low, signaling oversold conditions.
- Williams %R: The indicator has been consistently in the oversold territory, reflecting bearish sentiment.
Volatility Analysis:
- Bollinger Bands (BB): The bands have been narrowing, suggesting decreasing volatility.
- BB %B: The %B indicator has been declining, indicating a decrease in volatility.
- BB Width: The width of the bands has been contracting, pointing towards reduced price fluctuations.
Volume Analysis:
- On-Balance Volume (OBV): The OBV has been decreasing, indicating selling pressure.
- Chaikin Money Flow (CMF): The CMF has been relatively stable, suggesting a neutral money flow.
Key Observations and Opinions:
- Trend: The trend indicators show a clear downward trajectory, indicating a bearish outlook.
- Momentum: Momentum indicators confirm the bearish sentiment with oversold conditions and weakening momentum.
- Volatility: Volatility indicators suggest decreasing price fluctuations, potentially leading to a period of consolidation.
- Volume: The declining OBV and stable CMF point towards a lack of strong buying interest.
Conclusion:
Based on the analysis of the technical indicators, the next few days for SH stock are likely to see further downward movement. The bearish trend, supported by weakening momentum and decreasing volatility, indicates a high probability of continued price decline. Traders and investors should exercise caution and consider short-term selling strategies or wait for a more favorable entry point.