Technical Analysis of SGOL 2024-05-10
Overview:
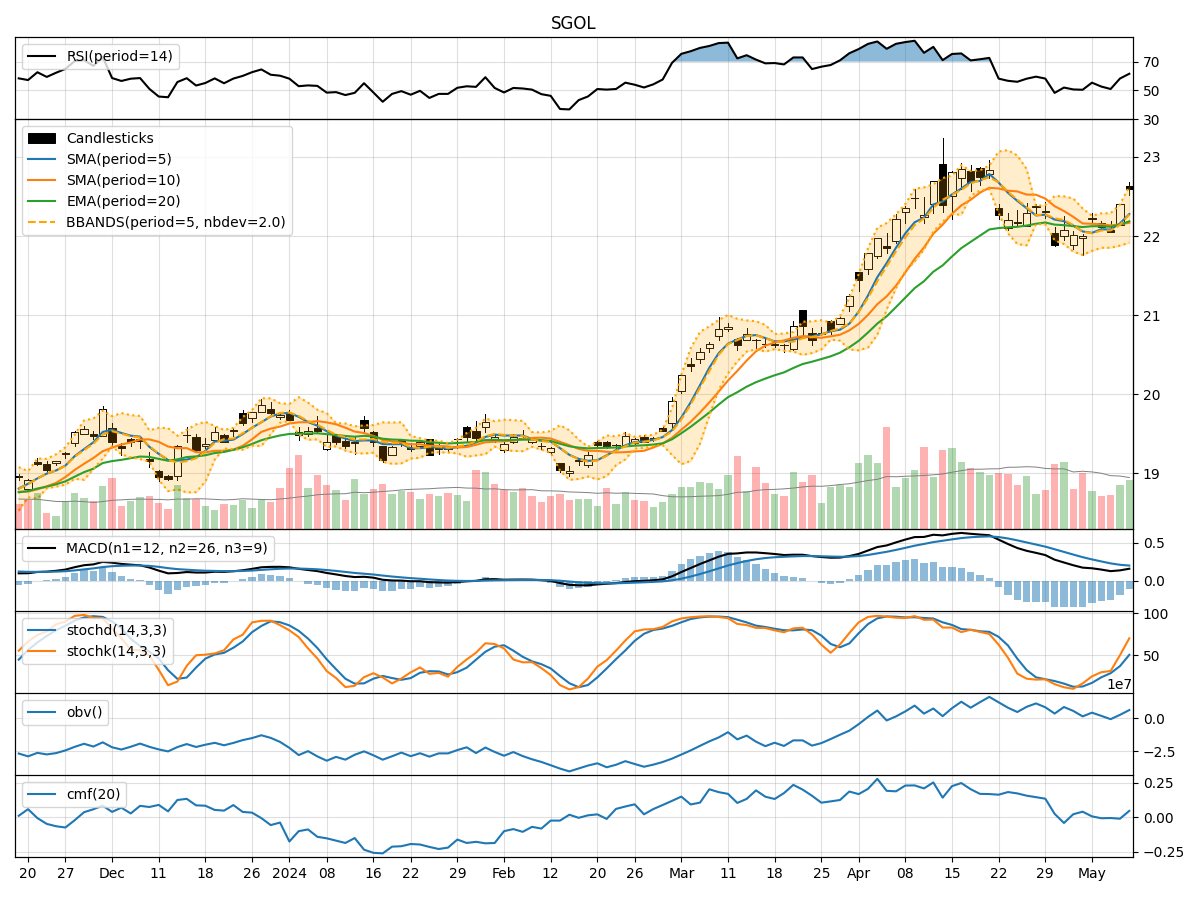
In analyzing the technical indicators for SGOL over the last 5 days, we will delve into the trend, momentum, volatility, and volume indicators to provide a comprehensive outlook on the possible stock price movement in the coming days.
Trend Analysis:
- Moving Averages (MA): The 5-day Moving Average (MA) has been trending slightly above the Simple Moving Average (SMA) and Exponential Moving Average (EMA) over the past 5 days, indicating a short-term bullish trend.
- MACD: The Moving Average Convergence Divergence (MACD) has shown positive values, with the MACD line consistently above the Signal line, suggesting bullish momentum.
Momentum Analysis:
- RSI: The Relative Strength Index (RSI) has been fluctuating around the neutral zone, indicating a lack of strong momentum in either direction.
- Stochastic Oscillator: Both %K and %D have been rising, reaching overbought levels, suggesting a potential reversal or consolidation.
Volatility Analysis:
- Bollinger Bands (BB): The stock price has been trading within the Bollinger Bands, with the bands widening slightly, indicating increased volatility.
Volume Analysis:
- On-Balance Volume (OBV): The OBV has shown mixed signals, with fluctuations in volume accumulation, suggesting indecision among market participants.
- Chaikin Money Flow (CMF): The CMF has been negative, indicating selling pressure in the market.
Key Observations:
- The trend indicators suggest a short-term bullish bias, supported by positive MACD values.
- Momentum indicators show a lack of strong momentum, with the RSI hovering around neutrality.
- Volatility has increased slightly, as seen in the widening Bollinger Bands.
- Volume indicators reflect mixed signals, with OBV showing fluctuations and CMF indicating selling pressure.
Conclusion:
Based on the analysis of the technical indicators, the stock price of SGOL is likely to experience sideways consolidation in the coming days. The bullish trend indicated by moving averages and MACD may be limited by the lack of strong momentum and the overbought levels in the stochastic oscillator. The increased volatility and mixed volume signals further support the view of a sideways movement. Therefore, it is recommended to exercise caution and closely monitor the price action for potential entry or exit points.