Technical Analysis of SELV 2024-05-10
Overview:
In analyzing the technical indicators for SELV stock over the last 5 days, we will delve into the trend, momentum, volatility, and volume indicators to provide a comprehensive outlook on the possible stock price movement in the coming days. By examining these key aspects, we aim to offer valuable insights and recommendations for potential investors.
Trend Indicators:
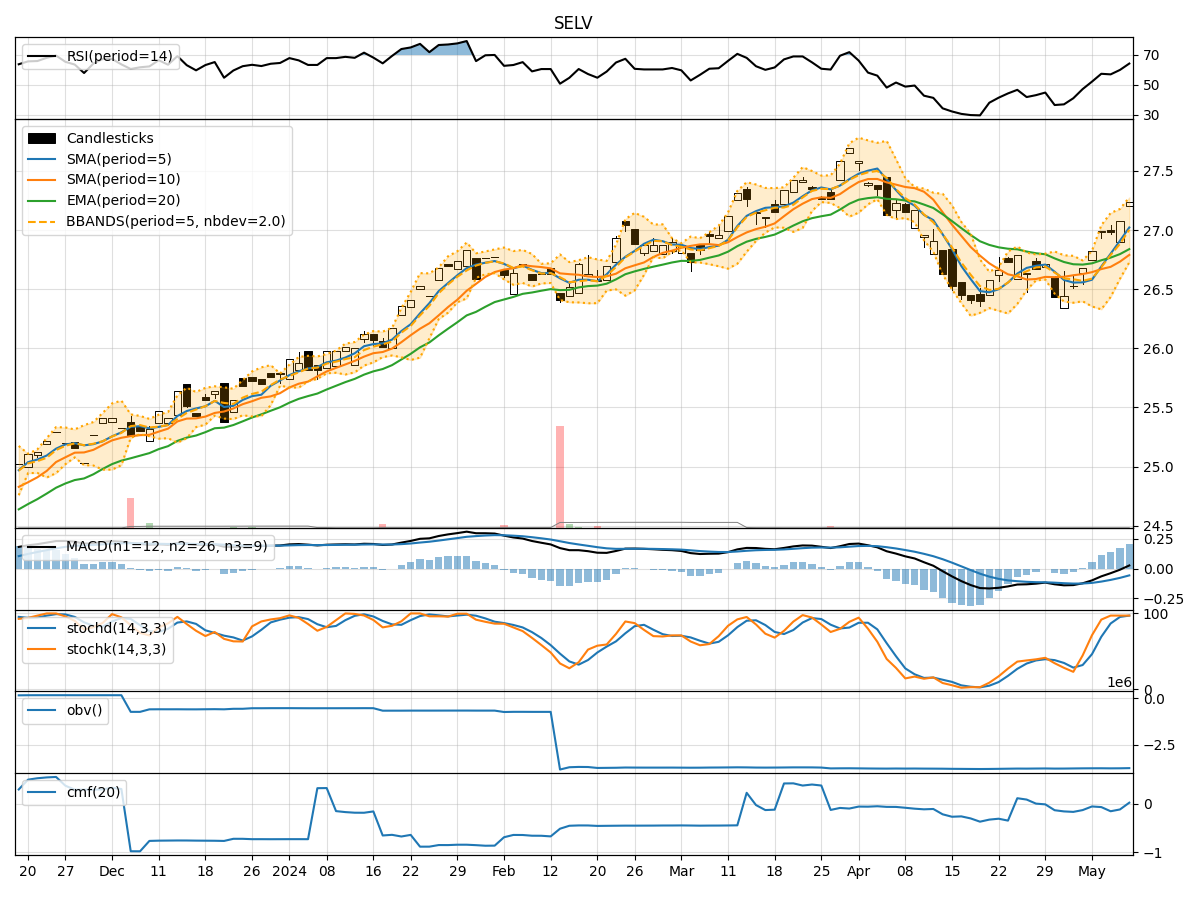
- Moving Averages (MA): The 5-day MA has been consistently above the closing prices, indicating a short-term uptrend.
- MACD: The MACD line has been positive, suggesting bullish momentum.
- RSI: The RSI has been fluctuating around the neutral zone, indicating a balanced market sentiment.
Momentum Indicators:
- Stochastic Oscillator: The stochastic indicators have been in the overbought zone, signaling a potential reversal.
- Williams %R: The Williams %R has been hovering around the oversold territory, suggesting a possible buying opportunity.
Volatility Indicators:
- Bollinger Bands: The stock price has been trading within the Bollinger Bands, indicating a period of consolidation.
- Volatility: The volatility has been relatively stable, with no significant spikes in price movements.
Volume Indicators:
- On-Balance Volume (OBV): The OBV has been slightly negative, indicating some distribution of shares.
- Chaikin Money Flow (CMF): The CMF has been negative, suggesting outflow of money from the stock.
Key Observations:
- The trend indicators show a bullish bias with positive MACD and MA trends.
- Momentum indicators suggest a potential reversal in the overbought zone.
- Volatility indicators point towards a period of consolidation.
- Volume indicators indicate a slight distribution of shares and outflow of money.
Conclusion:
Based on the analysis of the technical indicators, the next few days for SELV stock could see a potential consolidation phase with a slight downward bias. Investors should exercise caution as the stock may experience a pullback from the overbought levels indicated by the momentum indicators. It is advisable to wait for clearer signals or confirmation of a new trend direction before making significant trading decisions.