Technical Analysis of SDS 2024-05-03
Overview:
In analyzing the technical indicators for SDS over the last 5 days, we will delve into the trend, momentum, volatility, and volume indicators to provide a comprehensive outlook on the possible stock price movement in the coming days.
Trend Indicators:
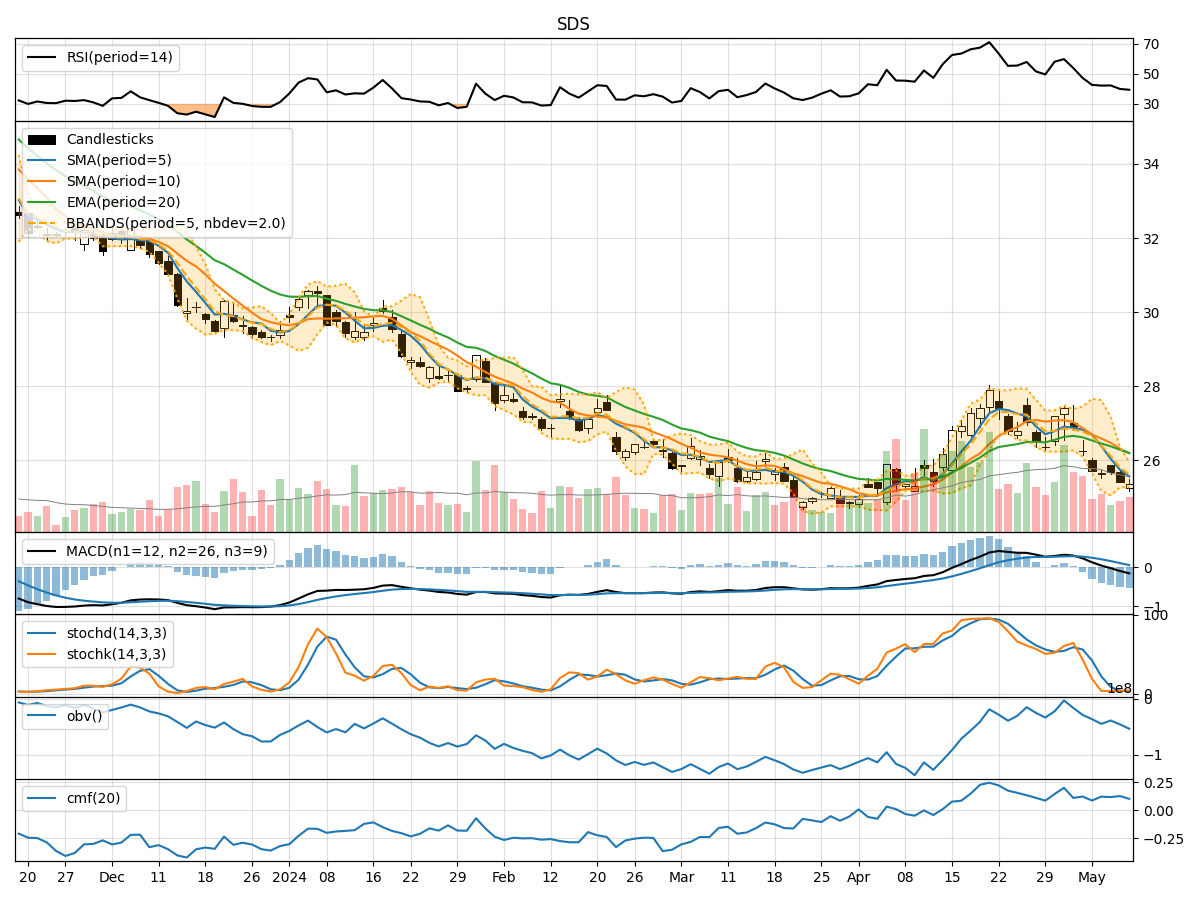
- Moving Averages (MA): The 5-day MA has been fluctuating around the 27 level, indicating a short-term consolidation phase. Both the SMA(10) and EMA(20) have been relatively stable, suggesting a neutral trend.
- MACD: The MACD line has shown slight fluctuations around the zero line, indicating a lack of strong momentum in either direction.
- MACD Histogram: The histogram has been oscillating around the zero line, reflecting indecision in the market.
Momentum Indicators:
- RSI: The RSI has been hovering around the mid-level of 50, indicating a balanced momentum between buying and selling pressure.
- Stochastic Oscillator: The stochastic indicators have shown mixed signals, with the %K line fluctuating and the %D line showing some divergence.
- Williams %R: The Williams %R has been in oversold territory, suggesting a potential reversal in the short term.
Volatility Indicators:
- Bollinger Bands: The Bollinger Bands have shown narrowing width, indicating decreasing volatility in the stock price.
- Bollinger %B: The %B indicator has been hovering around the middle range, suggesting a lack of extreme price movements.
Volume Indicators:
- On-Balance Volume (OBV): The OBV has shown a slight increase over the last few days, indicating some accumulation by investors.
- Chaikin Money Flow (CMF): The CMF has been positive, reflecting buying pressure in the market.
Key Observations and Opinions:
- Trend: The stock is currently in a consolidation phase with no clear trend direction.
- Momentum: Momentum indicators suggest a lack of strong buying or selling pressure.
- Volatility: Volatility has been decreasing, indicating a potential period of price stabilization.
- Volume: The increase in OBV and positive CMF suggest some underlying buying interest.
Conclusion:
Based on the analysis of the technical indicators, the stock price of SDS is likely to continue its sideways movement in the coming days. The lack of a clear trend, mixed momentum signals, decreasing volatility, and moderate buying interest indicate a period of consolidation. Traders may expect the stock to trade within a range with no significant directional bias. It is advisable to closely monitor key support and resistance levels for potential breakout opportunities.