Technical Analysis of SCO 2024-05-10
Overview:
In analyzing the technical indicators for SCO over the last 5 days, we will delve into the trend, momentum, volatility, and volume indicators to provide a comprehensive outlook on the possible stock price movement in the coming days. By examining these key indicators, we aim to offer valuable insights and predictions for potential investors.
Trend Analysis:
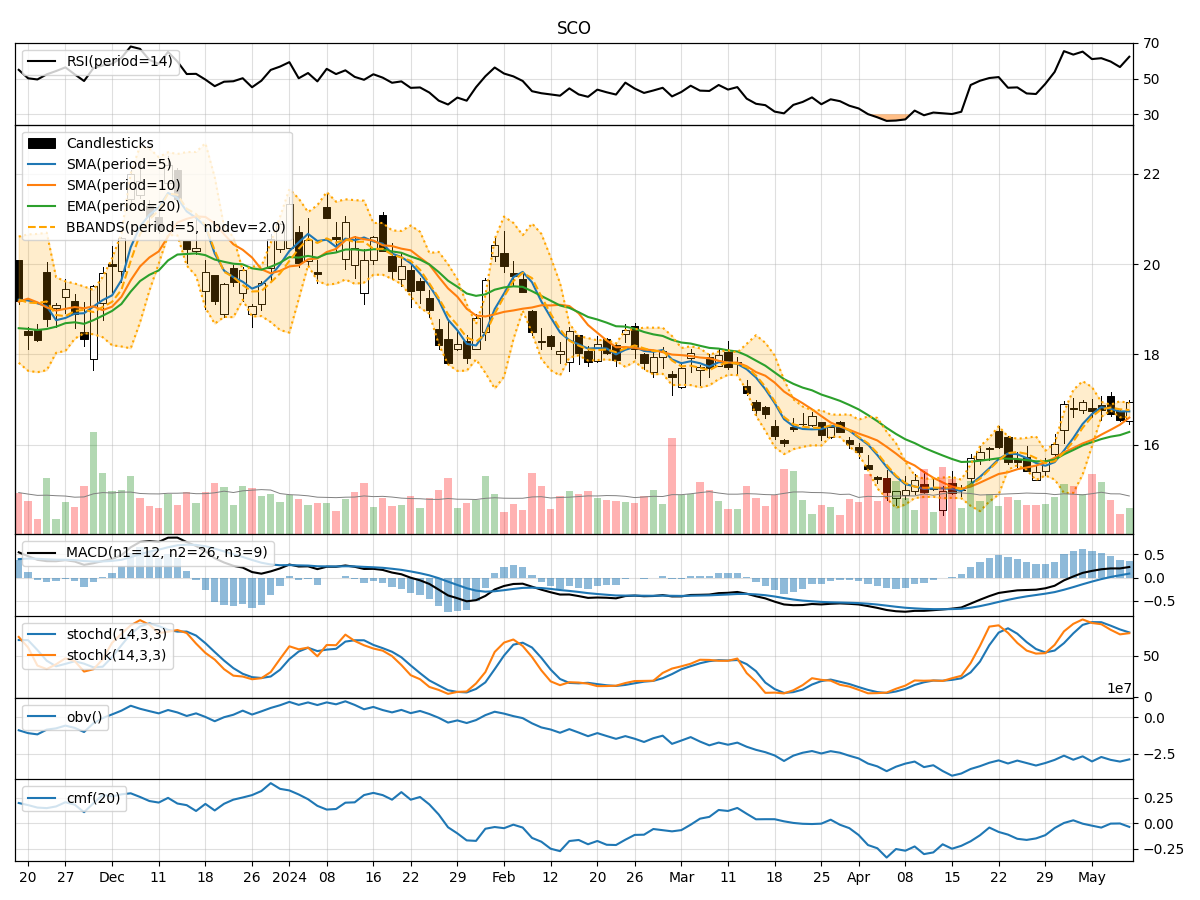
- Moving Averages (MA): The 5-day Moving Average (MA) has been relatively stable around the closing prices, indicating a consistent trend.
- MACD: The Moving Average Convergence Divergence (MACD) has shown positive values, suggesting a bullish trend.
- EMA: The Exponential Moving Average (EMA) has been gradually increasing, reflecting a positive momentum in the stock price.
Momentum Analysis:
- RSI: The Relative Strength Index (RSI) has been fluctuating around the mid-level, indicating a neutral momentum.
- Stochastic Oscillator: Both %K and %D values have been fluctuating, showing indecision in momentum.
- Williams %R: The Williams %R indicator has been hovering around oversold levels, suggesting a potential reversal.
Volatility Analysis:
- Bollinger Bands: The Bollinger Bands have shown narrowing bands, indicating decreasing volatility.
- Bollinger %B: The %B value has been fluctuating, reflecting mixed market sentiment.
Volume Analysis:
- On-Balance Volume (OBV): The OBV has been negative, indicating selling pressure in the stock.
- Chaikin Money Flow (CMF): The CMF has been negative, suggesting outflow of money from the stock.
Key Observations:
- The trend indicators suggest a bullish sentiment with positive MACD and EMA values.
- Momentum indicators show mixed signals with RSI indicating neutrality and Stochastic Oscillator showing indecision.
- Volatility has been decreasing, as indicated by the narrowing Bollinger Bands.
- Volume indicators reflect selling pressure with negative OBV and CMF values.
Conclusion:
Based on the analysis of the technical indicators, the stock price of SCO is likely to experience further consolidation in the coming days. The bullish trend indicated by the MACD and EMA may be hindered by the mixed momentum signals and selling pressure reflected in the volume indicators. The decreasing volatility suggests a period of stability, but the overall sentiment remains cautious. Therefore, it is advisable to exercise caution and closely monitor the price action for any potential shifts in market dynamics.