Technical Analysis of SCIO 2024-05-10
Overview:
In analyzing the technical indicators for SCIO over the last 5 days, we will delve into the trend, momentum, volatility, and volume indicators to provide a comprehensive outlook on the possible stock price movement in the coming days.
Trend Indicators:
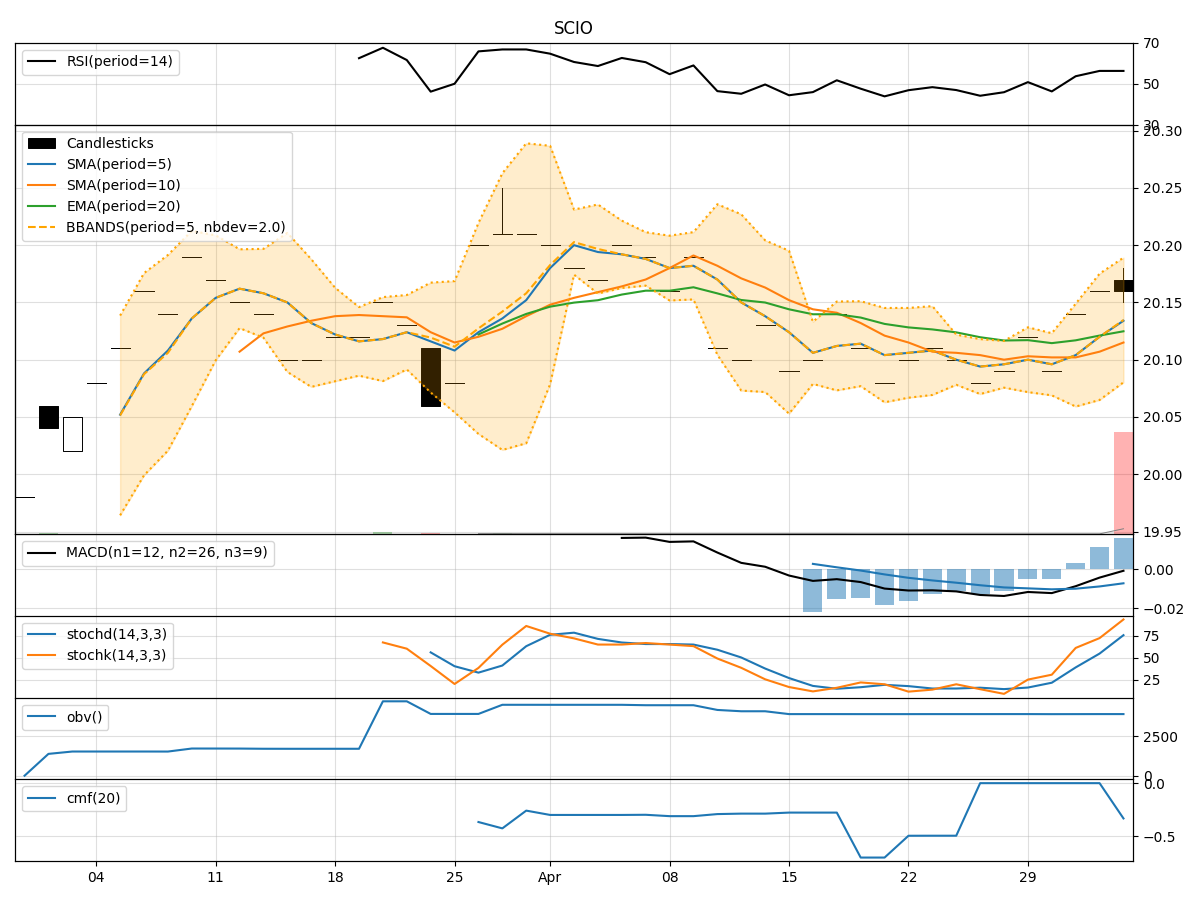
- Moving Averages (MA): The 5-day MA has been consistently above the closing price, indicating a short-term uptrend. Both the Simple Moving Average (SMA) and Exponential Moving Average (EMA) have been trending upwards, suggesting bullish momentum.
- Moving Average Convergence Divergence (MACD): The MACD line has been above the signal line, with both lines showing an upward trajectory. The MACD histogram has been increasing, indicating strengthening bullish momentum.
Momentum Indicators:
- Relative Strength Index (RSI): The RSI has been in the overbought territory, suggesting a potential pullback or consolidation in the near term.
- Stochastic Oscillator: Both %K and %D lines have been in the overbought zone, indicating a possible reversal or correction.
- Williams %R (Willams %R): The Williams %R has been in the oversold region, signaling a potential buying opportunity.
Volatility Indicators:
- Bollinger Bands (BB): The stock price has been trading within the upper Bollinger Band, indicating an overbought condition. The bands are narrowing, suggesting a potential decrease in volatility.
- Bollinger Band %B (BB %B): The %B indicator has been decreasing, indicating a possible shift towards consolidation or a downtrend.
Volume Indicators:
- On-Balance Volume (OBV): The OBV has been relatively flat, suggesting a lack of strong buying or selling pressure.
- Chaikin Money Flow (CMF): The CMF has been negative, indicating a net outflow of money from the stock.
Key Observations and Opinions:
- Trend: The trend indicators point towards a bullish bias in the short term.
- Momentum: Momentum indicators suggest a potential reversal or correction due to overbought conditions.
- Volatility: Volatility indicators indicate a potential decrease in volatility and a shift towards consolidation.
- Volume: Volume indicators show a lack of significant buying or selling pressure.
Conclusion:
Based on the analysis of the technical indicators, the next few days' possible stock price movement for SCIO is likely to experience a short-term correction or consolidation. The overbought conditions in momentum indicators and the narrowing Bollinger Bands suggest a potential pullback in the stock price. Traders may consider taking profits or waiting for a better entry point before considering long positions.