Technical Analysis of RSPE 2024-05-10
Overview:
In analyzing the technical indicators for RSPE stock over the last 5 days, we will delve into the trend, momentum, volatility, and volume indicators to provide a comprehensive outlook on the possible stock price movement in the upcoming days. By examining these key indicators, we aim to offer valuable insights and recommendations for potential investors.
Trend Indicators:
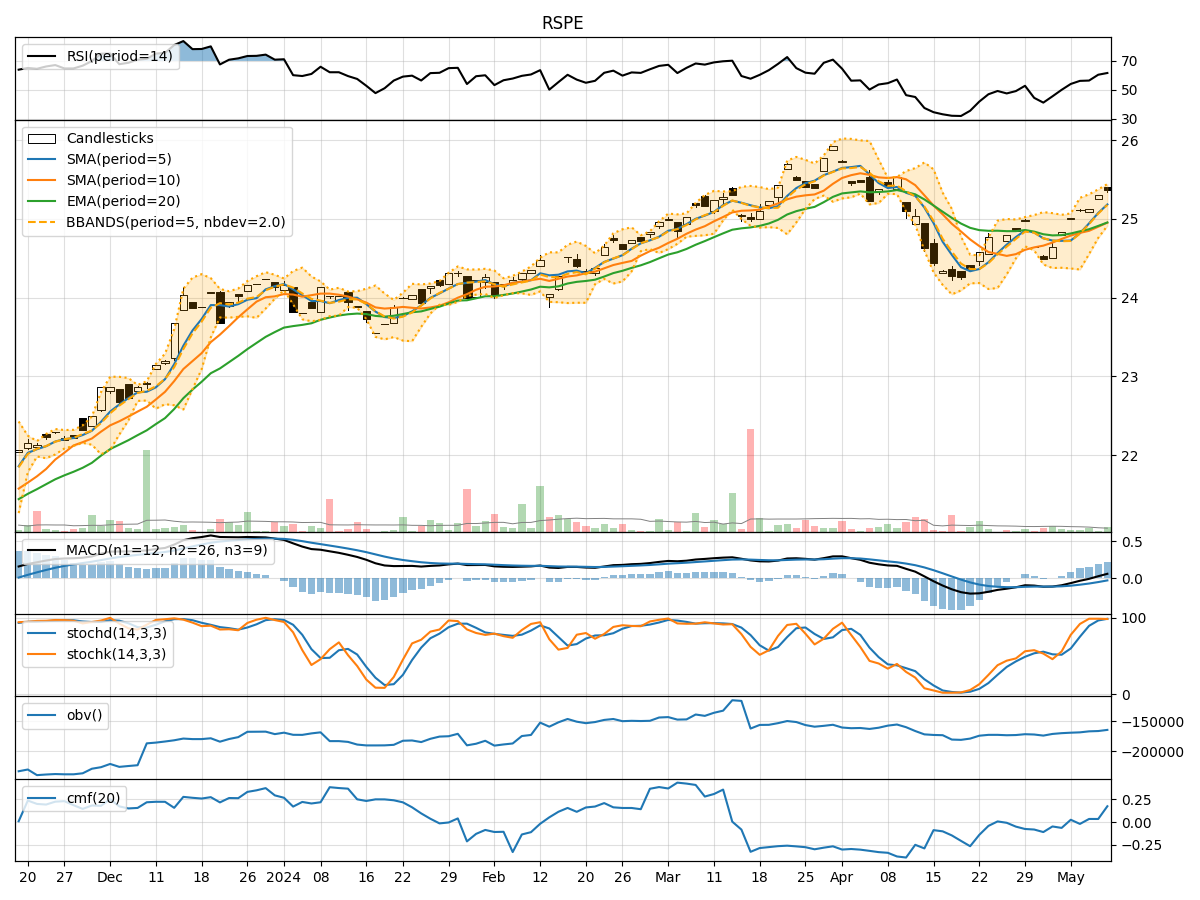
- Moving Averages (MA): The 5-day Moving Average (MA) has been consistently above the Simple Moving Average (SMA) and Exponential Moving Average (EMA), indicating a bullish trend.
- MACD: The MACD line has been consistently above the signal line, with both lines showing an upward trend, suggesting bullish momentum.
- MACD Histogram: The MACD Histogram has been increasing over the past 5 days, indicating strengthening bullish momentum.
Momentum Indicators:
- RSI: The Relative Strength Index (RSI) has been gradually increasing and is currently in the overbought territory, suggesting a potential pullback in the near future.
- Stochastic Oscillator: Both %K and %D lines of the Stochastic Oscillator are in the overbought zone, indicating a possible reversal or consolidation.
- Williams %R: The Williams %R is in the oversold territory, signaling a potential reversal in the stock price.
Volatility Indicators:
- Bollinger Bands: The stock price has been trading within the Bollinger Bands, with the bands narrowing, indicating decreasing volatility.
- Bollinger %B: The %B indicator is hovering around 0.8, suggesting that the stock is trading near the upper band, potentially indicating an overbought condition.
Volume Indicators:
- On-Balance Volume (OBV): The OBV has been steadily increasing over the past 5 days, indicating accumulation by investors.
- Chaikin Money Flow (CMF): The CMF is positive and has been trending upwards, indicating buying pressure in the stock.
Conclusion:
Based on the analysis of the technical indicators, the stock is currently exhibiting strong bullish momentum, supported by the uptrend in moving averages and MACD. However, the overbought conditions in RSI and Stochastic Oscillator suggest a potential pullback or consolidation in the near term. The decreasing volatility as indicated by the Bollinger Bands narrowing also supports the view of a possible consolidation phase.
Key Conclusion:
- Short-Term Outlook: The stock may experience a slight pullback or consolidation in the next few days due to overbought conditions in RSI and Stochastic Oscillator.
- Long-Term View: The overall trend remains bullish, and any pullback could present a buying opportunity for investors looking to enter the stock for the long term.
Recommendation:
- Consider: Investors may consider waiting for a potential pullback to enter at a more favorable price point.
- Monitor: Keep a close eye on the RSI and Stochastic Oscillator for signs of a reversal or consolidation.
- Diversify: It is essential to diversify your portfolio to mitigate risks associated with individual stock movements.
Overall Sentiment:
- Bullish with a Short-Term Caution: While the long-term outlook remains positive, exercise caution in the short term due to potential overbought conditions.
By carefully monitoring the key technical indicators and market dynamics, investors can make informed decisions to navigate the stock market effectively.