Technical Analysis of QVMM 2024-05-31
Overview:
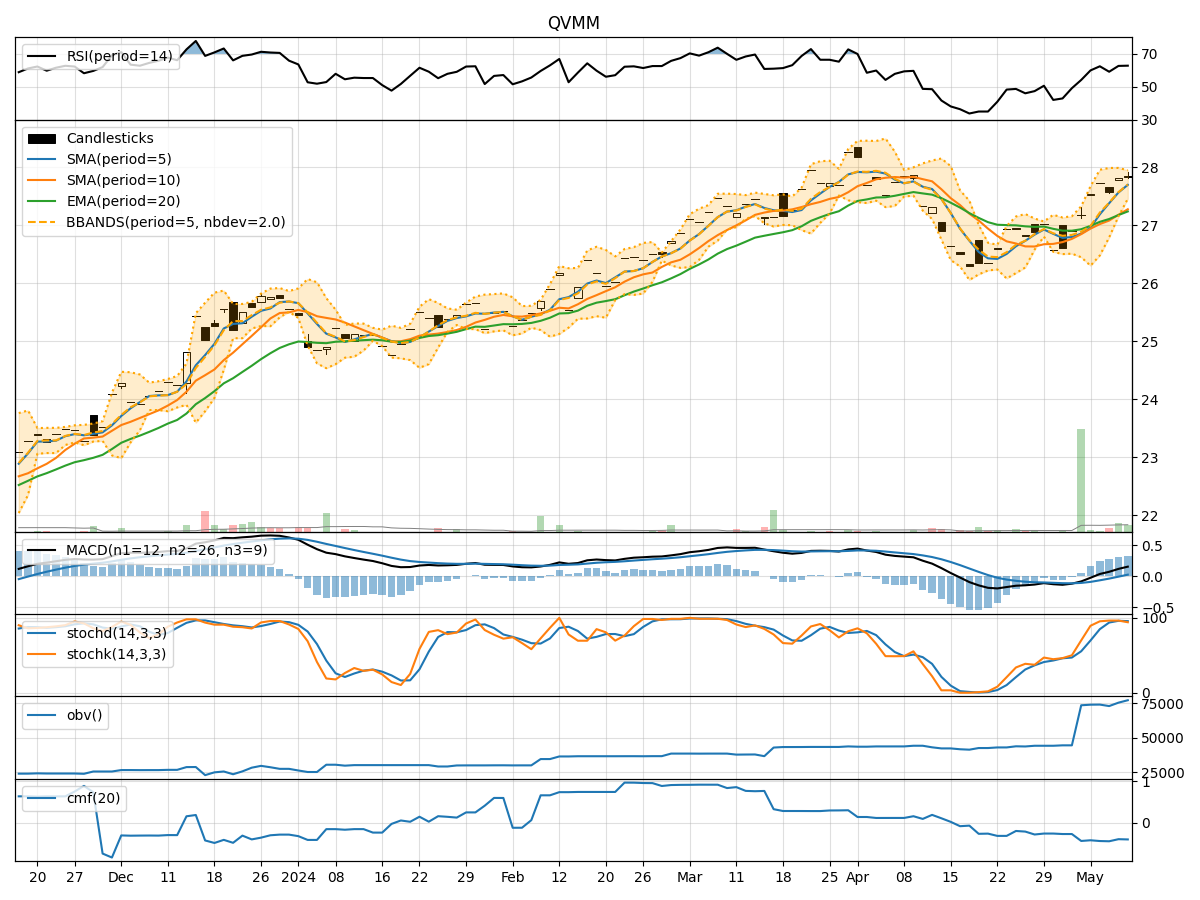
In analyzing the provided QVMM TA data for the last 5 days, we will delve into the technical indicators across trend, momentum, volatility, and volume to derive insights into the possible future stock price movement. By examining these indicators comprehensively, we aim to provide a well-structured and informative analysis to guide your decision-making process.
Trend Analysis:
- Moving Averages (MA): The 5-day MA has been consistently below the closing prices, indicating a short-term downtrend.
- MACD: The MACD line has been below the signal line, suggesting a bearish momentum.
- RSI: The RSI has been fluctuating around the 50 level, indicating a lack of strong trend direction.
Momentum Analysis:
- Stochastic Oscillator: Both %K and %D have been in oversold territory, signaling a potential reversal.
- Williams %R: The indicator has been in oversold territory, suggesting a possible buying opportunity.
Volatility Analysis:
- Bollinger Bands (BB): The stock price has been trading within the bands, indicating a period of consolidation.
- BB Percentage (BBP): The BBP has been relatively low, suggesting a lack of significant price movement.
Volume Analysis:
- On-Balance Volume (OBV): The OBV has been relatively flat, indicating a balance between buying and selling pressure.
- Chaikin Money Flow (CMF): The CMF has been negative, reflecting a bearish money flow trend.
Key Observations and Opinions:
- Trend: The trend indicators suggest a bearish sentiment in the short term.
- Momentum: Momentum indicators point towards a potential reversal from oversold levels.
- Volatility: Volatility indicators indicate a period of consolidation and low price movement.
- Volume: Volume indicators show a lack of significant buying or selling pressure.
Conclusion:
Based on the analysis of the technical indicators, the stock is likely to experience sideways movement in the next few days. The bearish trend and lack of strong momentum signal a period of consolidation, supported by low volatility and balanced volume. Traders may consider staying cautious and monitoring for a clear trend direction before making significant trading decisions.