Technical Analysis of QTUM 2024-05-10
Overview:
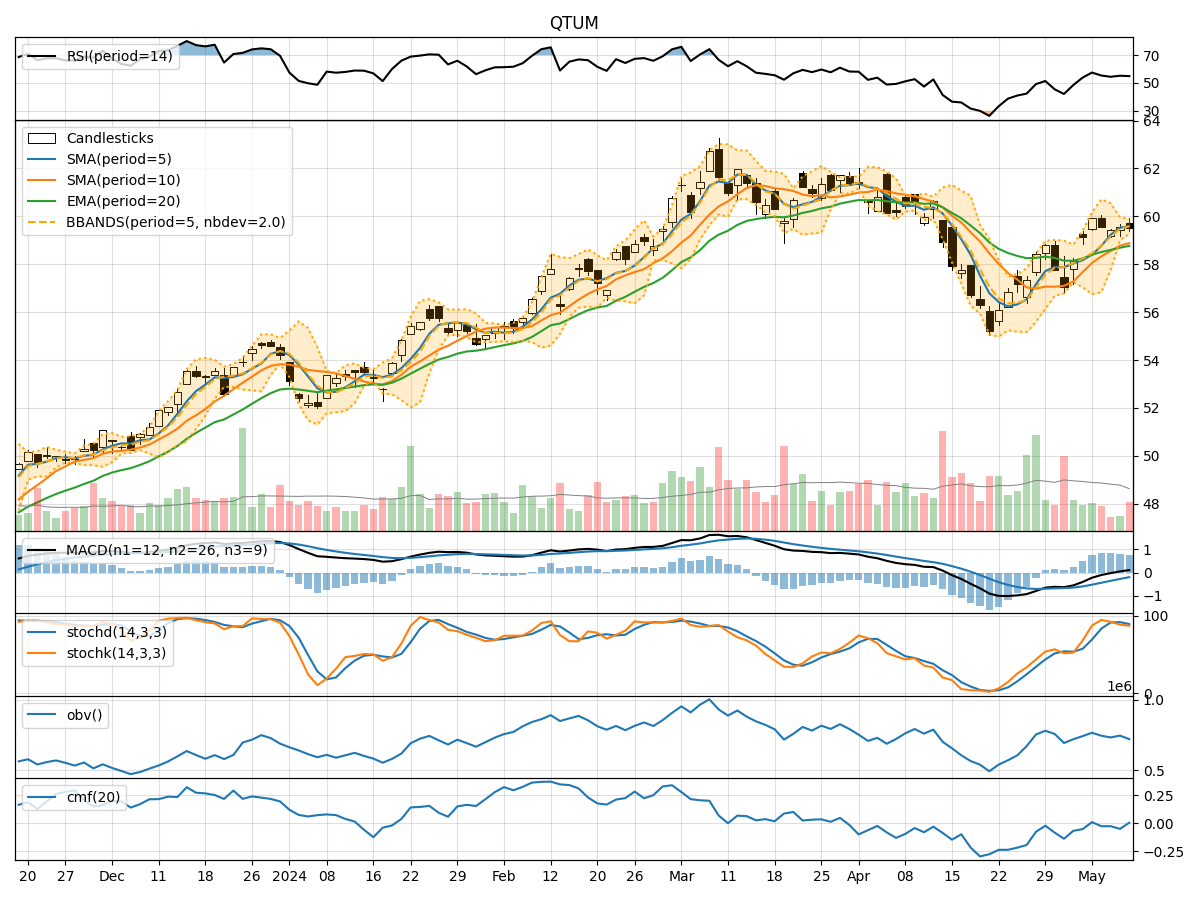
In analyzing the technical indicators for QTUM over the last 5 days, we will delve into the trend, momentum, volatility, and volume indicators to provide a comprehensive outlook on the possible stock price movement. By examining these key aspects, we aim to offer valuable insights and predictions for the upcoming days.
Trend Analysis:
- Moving Averages (MA): The 5-day Moving Average (MA) has been consistently above the Simple Moving Average (SMA) and Exponential Moving Average (EMA), indicating a bullish trend.
- MACD: The MACD line has been consistently above the signal line, with the MACD histogram showing positive values, suggesting bullish momentum.
Momentum Analysis:
- RSI: The Relative Strength Index (RSI) has been fluctuating around the overbought territory, indicating strong buying pressure.
- Stochastic Oscillator: Both %K and %D lines have been in the overbought zone, suggesting a potential reversal or consolidation.
Volatility Analysis:
- Bollinger Bands (BB): The stock price has mostly remained within the Bollinger Bands, with the bands narrowing, indicating decreasing volatility.
Volume Analysis:
- On-Balance Volume (OBV): The OBV has shown a mixed trend, with some days experiencing negative volume divergence, suggesting potential profit-taking.
- Chaikin Money Flow (CMF): The CMF has been mostly negative, indicating distribution rather than accumulation.
Key Observations:
- The trend indicators suggest a strong bullish sentiment, supported by the moving averages and MACD.
- Momentum indicators show a mixed signal, with RSI indicating overbought conditions and Stochastic Oscillator hinting at a possible reversal.
- Volatility has been decreasing, as seen in the narrowing Bollinger Bands, which may lead to a period of consolidation.
- Volume indicators point towards some selling pressure, as evidenced by the negative OBV and CMF values.
Conclusion:
Based on the analysis of the technical indicators, the next few days for QTUM are likely to see sideways movement or a slight pullback. While the trend remains bullish, the overbought conditions indicated by the momentum indicators and the negative volume divergence suggest a potential period of consolidation. Traders should exercise caution and consider taking profits or implementing risk management strategies in anticipation of a possible correction.