Technical Analysis of QTR 2024-05-10
Overview:
In analyzing the provided Technical Analysis (TA) data for the last 5 days, we will delve into the trend, momentum, volatility, and volume indicators to forecast the possible stock price movement for the next few days. By examining these key indicators, we aim to provide a comprehensive and insightful prediction backed by data-driven analysis.
Trend Indicators:
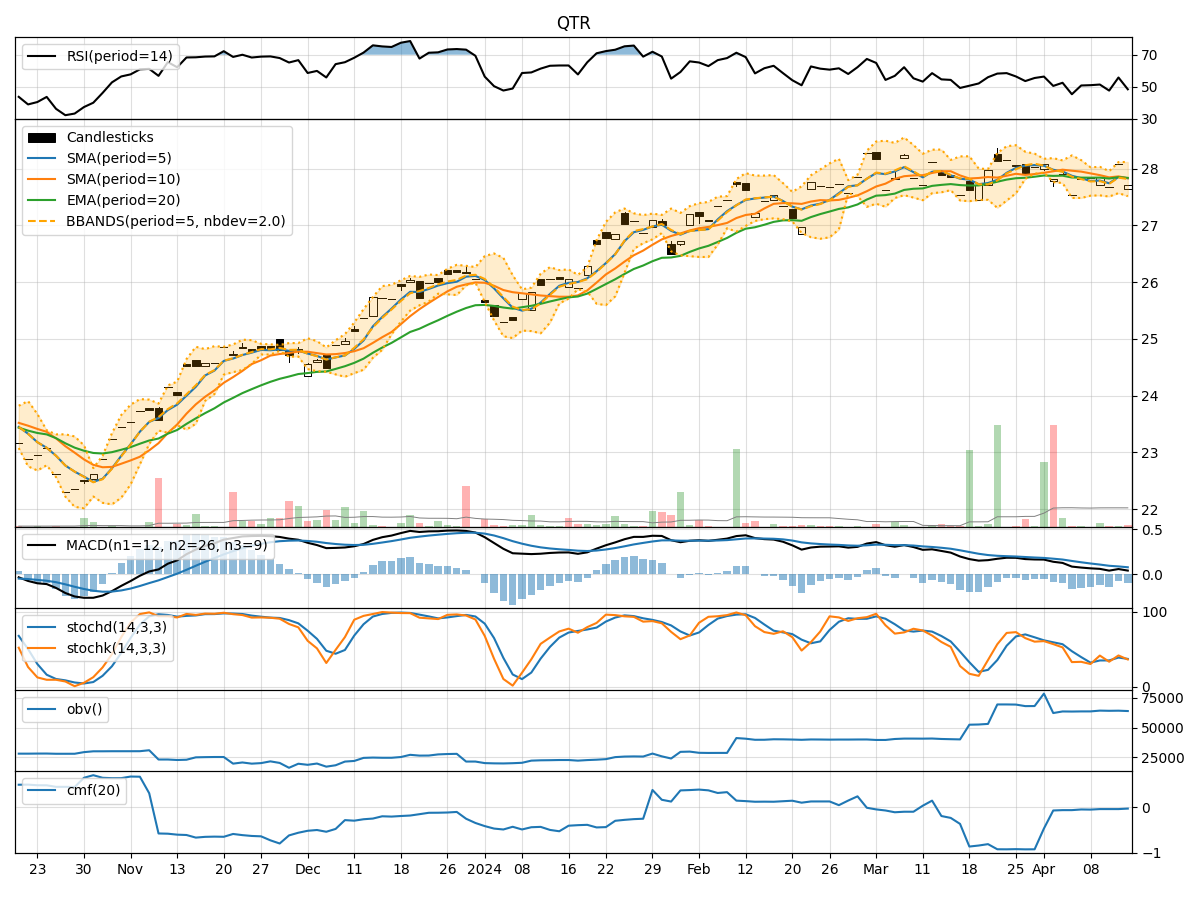
- Moving Averages (MA): The 5-day Moving Average (MA) has been consistently increasing, indicating a bullish trend.
- MACD: The Moving Average Convergence Divergence (MACD) has been positive and rising, suggesting bullish momentum.
- EMA: The Exponential Moving Average (EMA) has been trending upwards, supporting the bullish sentiment.
Momentum Indicators:
- RSI: The Relative Strength Index (RSI) has been in the neutral to slightly overbought territory, indicating potential for a pullback.
- Stochastic Oscillator: Both %K and %D have been in the overbought zone, signaling a possible reversal.
- Williams %R: The Williams %R is showing oversold conditions, hinting at a potential bounce.
Volatility Indicators:
- Bollinger Bands (BB): The stock price has been trading within the bands, suggesting a period of consolidation.
- BB Width: The Bollinger Bands Width has been narrowing, indicating decreasing volatility.
- BB %B: The %B indicator is hovering around the middle, reflecting a balanced market sentiment.
Volume Indicators:
- On-Balance Volume (OBV): The OBV has been fluctuating, showing mixed buying and selling pressure.
- Chaikin Money Flow (CMF): The CMF has been negative, indicating outflow of money from the stock.
Conclusion:
Based on the analysis of the technical indicators: - Trend: The stock is in an upward trend supported by moving averages and MACD. - Momentum: Momentum indicators suggest a potential pullback due to overbought conditions. - Volatility: Volatility is decreasing, indicating a possible period of consolidation. - Volume: Mixed volume indicators suggest uncertainty in market participation.
Forecast:
Considering the overall analysis, the stock is likely to experience a short-term pullback or consolidation in the next few days before potentially resuming its upward trend. Traders should watch for signs of reversal in momentum indicators and monitor volume for confirmation of the price movement. It is advisable to exercise caution and wait for clearer signals before making significant trading decisions.