Technical Analysis of QQXT 2024-05-10
Overview:
In analyzing the technical indicators for the stock QQXT over the last 5 days, we will delve into the trends, momentum, volatility, and volume indicators to provide insights into the possible future stock price movements. By examining these key indicators, we aim to offer a comprehensive analysis and make informed predictions for the upcoming days.
Trend Analysis:
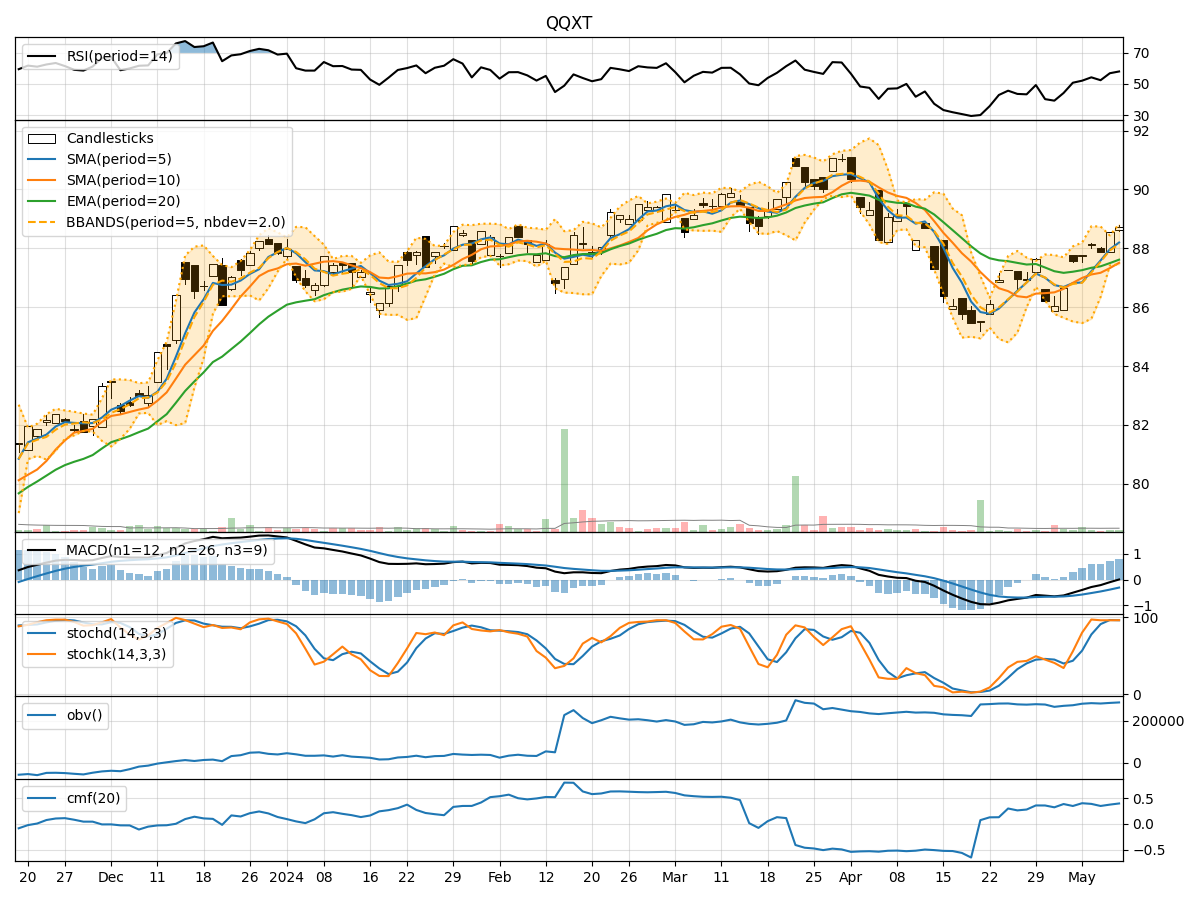
- Moving Averages (MA): The 5-day Moving Average (MA) has been consistently above the Simple Moving Average (SMA) and Exponential Moving Average (EMA), indicating a bullish trend.
- MACD: The MACD line has been above the signal line for the past few days, suggesting a bullish momentum in the stock.
- MACD Histogram: The MACD Histogram has been increasing, indicating strengthening bullish momentum.
Momentum Analysis:
- RSI: The Relative Strength Index (RSI) has been fluctuating around the 50 level, indicating a neutral momentum in the stock.
- Stochastic Oscillator: The Stochastic Oscillator has been in the overbought zone, suggesting a potential reversal in the stock's momentum.
- Williams %R: The Williams %R indicator has been hovering around the oversold territory, signaling a possible reversal in the stock's momentum.
Volatility Analysis:
- Bollinger Bands: The Bollinger Bands have been narrowing, indicating decreasing volatility in the stock.
- Bollinger %B: The %B indicator has been fluctuating within a tight range, suggesting a period of consolidation in the stock.
Volume Analysis:
- On-Balance Volume (OBV): The OBV indicator has been showing a slight increase, indicating buying pressure in the stock.
- Chaikin Money Flow (CMF): The CMF indicator has been positive, suggesting that money is flowing into the stock.
Conclusion:
Based on the analysis of the technical indicators, the stock QQXT is likely to experience sideways movement in the next few days. The trend indicators point towards a bullish bias, supported by the moving averages and MACD. However, the momentum indicators show signs of potential reversal with the Stochastic Oscillator and Williams %R signaling overbought conditions.
The volatility indicators suggest a decrease in volatility, which aligns with the expected sideways movement. The volume indicators indicate moderate buying pressure but not strong enough to drive a significant upward movement.
In conclusion, while the stock may see some fluctuations, the overall outlook leans towards consolidation with a neutral to slightly bullish bias. Traders should closely monitor key support and resistance levels for potential entry and exit points.