Technical Analysis of QQQJ 2024-05-10
Overview:
In analyzing the technical indicators for QQQJ over the last 5 days, we will delve into the trends, momentum, volatility, and volume indicators to provide a comprehensive outlook on the possible stock price movement in the coming days. By examining these key aspects, we aim to offer valuable insights and predictions for potential investors.
Trend Indicators:
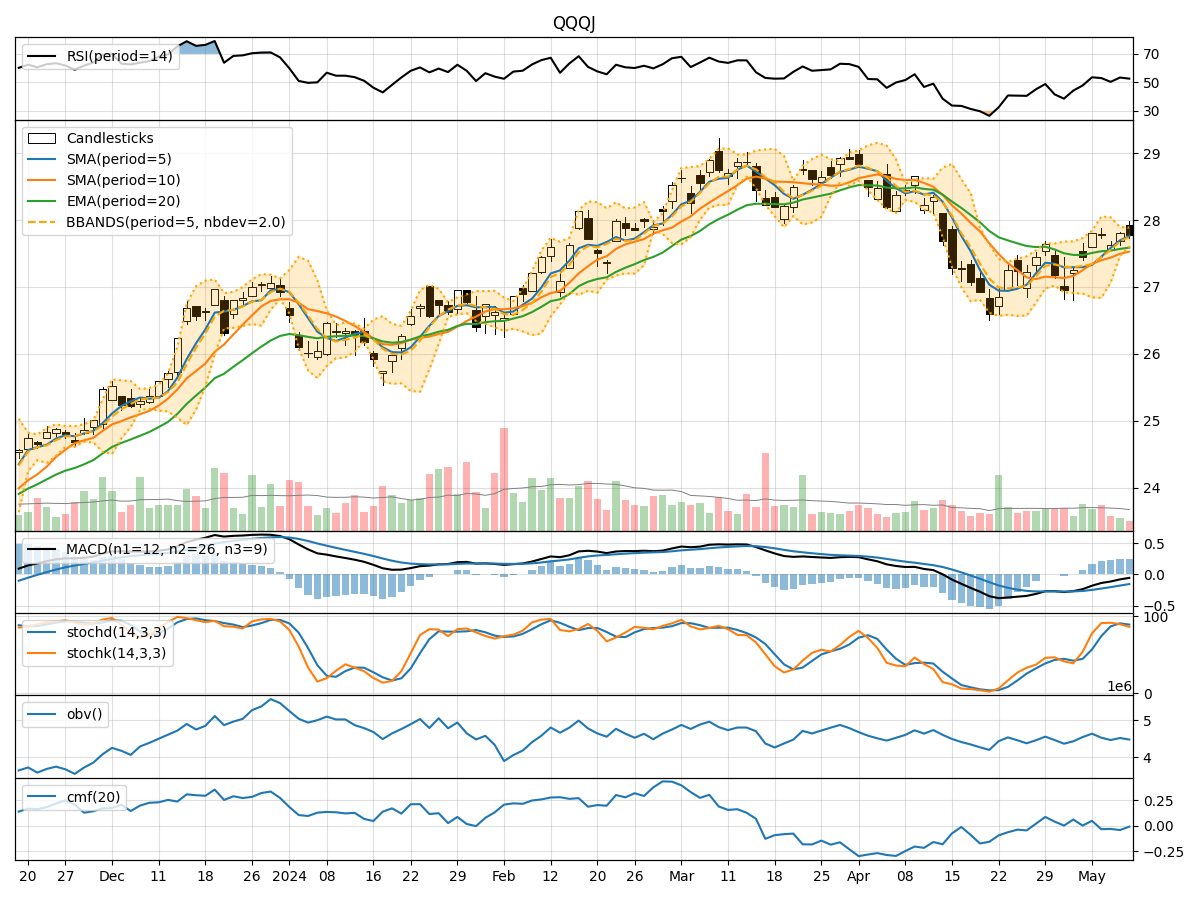
- Moving Averages (MA): The 5-day Moving Average has been consistently above the closing prices, indicating a short-term uptrend.
- MACD: The MACD line has been negative but showing signs of convergence towards the signal line, suggesting a potential reversal in the short term.
- EMA: The Exponential Moving Average has been relatively stable, reflecting a gradual uptrend.
Key Observation: The trend indicators suggest a mixed outlook with a slight bullish bias in the short term.
Momentum Indicators:
- RSI: The Relative Strength Index has been fluctuating around the neutral zone, indicating indecision in the market.
- Stochastic Oscillator: Both %K and %D have been declining, signaling a potential bearish momentum.
- Williams %R: The indicator has been in the oversold territory, suggesting a possible reversal to the upside.
Key Observation: Momentum indicators point towards a bearish sentiment in the short term.
Volatility Indicators:
- Bollinger Bands: The bands have been narrowing, indicating decreasing volatility and a potential breakout soon.
- Bollinger %B: The %B indicator has been hovering around the middle range, reflecting consolidation.
- Average True Range (ATR): ATR has been decreasing, suggesting a decline in price volatility.
Key Observation: Volatility indicators signal a period of consolidation and potential price breakout in the near future.
Volume Indicators:
- On-Balance Volume (OBV): The OBV has been fluctuating, showing no clear trend in volume accumulation.
- Chaikin Money Flow (CMF): The CMF has been negative, indicating selling pressure in the market.
Key Observation: Volume indicators suggest a lack of strong buying interest and potential selling pressure.
Conclusion:
Based on the analysis of trend, momentum, volatility, and volume indicators, the next few days' possible stock price movement for QQQJ is sideways consolidation with a slight bearish bias. The mixed signals from trend and volatility indicators, coupled with bearish momentum and volume indicators, indicate a period of indecision and potential downside pressure in the short term. Traders should exercise caution and closely monitor key support and resistance levels for potential trading opportunities.
Recommendation:
- Short-term Traders: Consider short-term bearish positions with tight stop-loss orders to manage risk.
- Long-term Investors: Monitor the price action for a potential entry point during the consolidation phase.
- Risk Management: Implement proper risk management strategies to protect capital in a volatile market environment.
By combining technical analysis with market insights, investors can make informed decisions and navigate the dynamic landscape of the stock market effectively.