Technical Analysis of QQQE 2024-05-10
Overview:
In analyzing the technical indicators for QQQE over the last 5 days, we will delve into the trend, momentum, volatility, and volume indicators to provide a comprehensive outlook on the possible stock price movement in the coming days. By examining these key aspects, we aim to offer valuable insights and predictions to guide your investment decisions.
Trend Analysis:
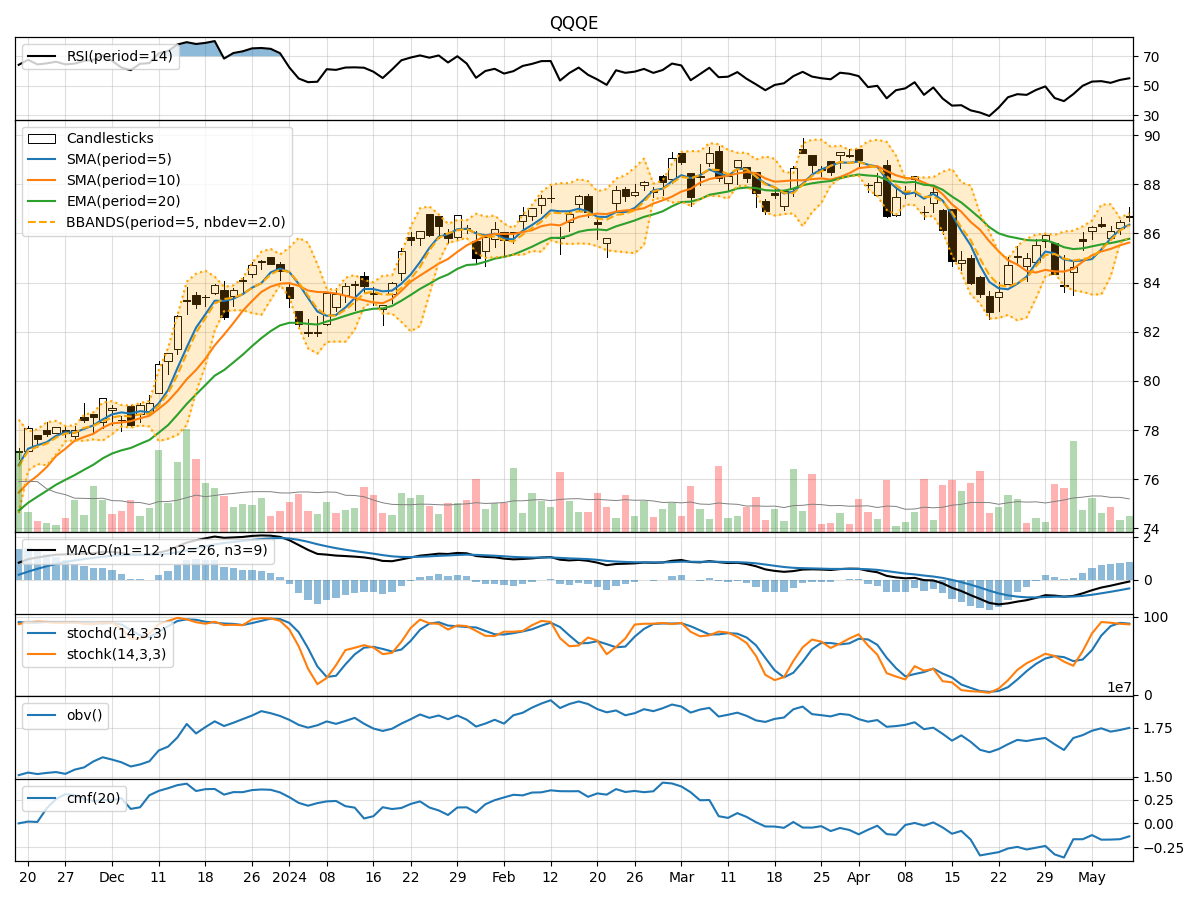
- Moving Averages (MA): The 5-day MA has been consistently above the closing prices, indicating a short-term uptrend.
- MACD: The MACD line has been below the signal line but showing signs of convergence, suggesting a potential shift towards a bullish momentum.
- RSI: The RSI values have been fluctuating around the neutral zone, indicating a lack of strong trend direction.
Key Observation: The trend indicators suggest a mixed outlook with a slight bullish bias.
Momentum Analysis:
- Stochastic Oscillator: Both %K and %D values have been relatively high, indicating overbought conditions in the market.
- Williams %R: The values have been fluctuating around the oversold region, suggesting potential buying opportunities.
Key Observation: Momentum indicators signal a potential reversal or consolidation phase in the near term.
Volatility Analysis:
- Bollinger Bands (BB): The bands have been narrowing, indicating decreasing volatility in the stock price.
- BB %B: The %B values have been hovering around the midline, reflecting a balanced market sentiment.
Key Observation: Volatility indicators point towards a period of consolidation or a potential breakout.
Volume Analysis:
- On-Balance Volume (OBV): The OBV values have been fluctuating, indicating indecision among market participants.
- Chaikin Money Flow (CMF): The CMF values have been negative, suggesting a net outflow of money from the stock.
Key Observation: Volume indicators reflect a lack of strong buying or selling pressure in the market.
Conclusion:
Based on the analysis of the technical indicators, the next few days for QQQE could see sideways movement with a slight bullish bias. The trend indicators hint at a potential uptrend, while momentum indicators suggest a possible reversal or consolidation phase. Volatility indicators point towards a period of consolidation, and volume indicators indicate indecision among market participants.
Overall View: The stock is likely to experience sideways movement with a slight bullish bias in the coming days. Traders should closely monitor key support and resistance levels for potential entry and exit points.
Remember, market conditions can change rapidly, so it's essential to stay updated with real-time data and adjust your trading strategy accordingly.