Technical Analysis of QQQD 2024-05-10
Overview:
In analyzing the technical indicators for QQQD over the last 5 days, we will delve into the trend, momentum, volatility, and volume indicators to provide a comprehensive outlook on the possible stock price movement in the coming days. By examining these key aspects, we aim to offer valuable insights and predictions for informed decision-making.
Trend Analysis:
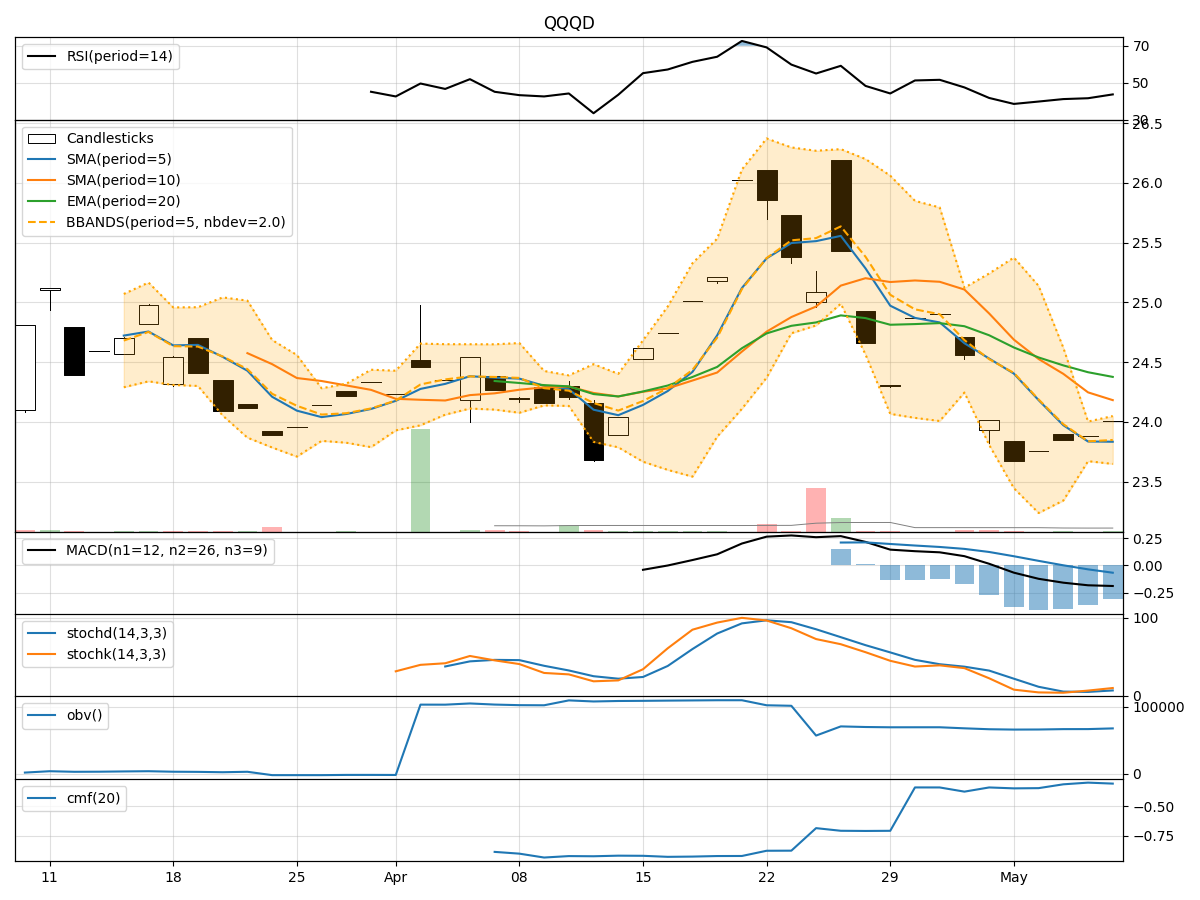
- Moving Averages (MA): The 5-day MA has been consistently below the closing prices, indicating a downward trend.
- MACD: The MACD line has been negative, with the MACD histogram showing a decreasing trend, suggesting bearish momentum.
Momentum Analysis:
- RSI: The RSI has been relatively low, indicating oversold conditions.
- Stochastic Oscillator: Both %K and %D have been increasing but remain in oversold territory, signaling a potential reversal.
Volatility Analysis:
- Bollinger Bands (BB): The stock price has been trading below the lower Bollinger Band, indicating oversold conditions.
Volume Analysis:
- On-Balance Volume (OBV): The OBV has shown a slight increase, suggesting some buying interest.
- Chaikin Money Flow (CMF): The CMF has been negative, indicating selling pressure.
Key Observations:
- The stock is currently in a downtrend based on moving averages and MACD.
- Momentum indicators suggest oversold conditions, potentially signaling a reversal.
- Volatility indicators show the stock is oversold, which could lead to a bounce back.
- Volume indicators reflect some buying interest but overall selling pressure remains.
Conclusion:
Based on the analysis of the technical indicators, the stock is currently in a bearish phase with oversold conditions. However, there are signs of a potential reversal in momentum and volatility, indicating a possible upward movement in the coming days. Traders should closely monitor the price action for confirmation of a trend reversal before considering any long positions.