Technical Analysis of QQQ 2024-05-10
Overview:
In analyzing the technical indicators for the last 5 days of QQQ stock, we will delve into the trend, momentum, volatility, and volume indicators to provide a comprehensive outlook on the possible stock price movement in the coming days. By examining these key indicators, we aim to offer valuable insights and predictions for informed decision-making.
Trend Analysis:
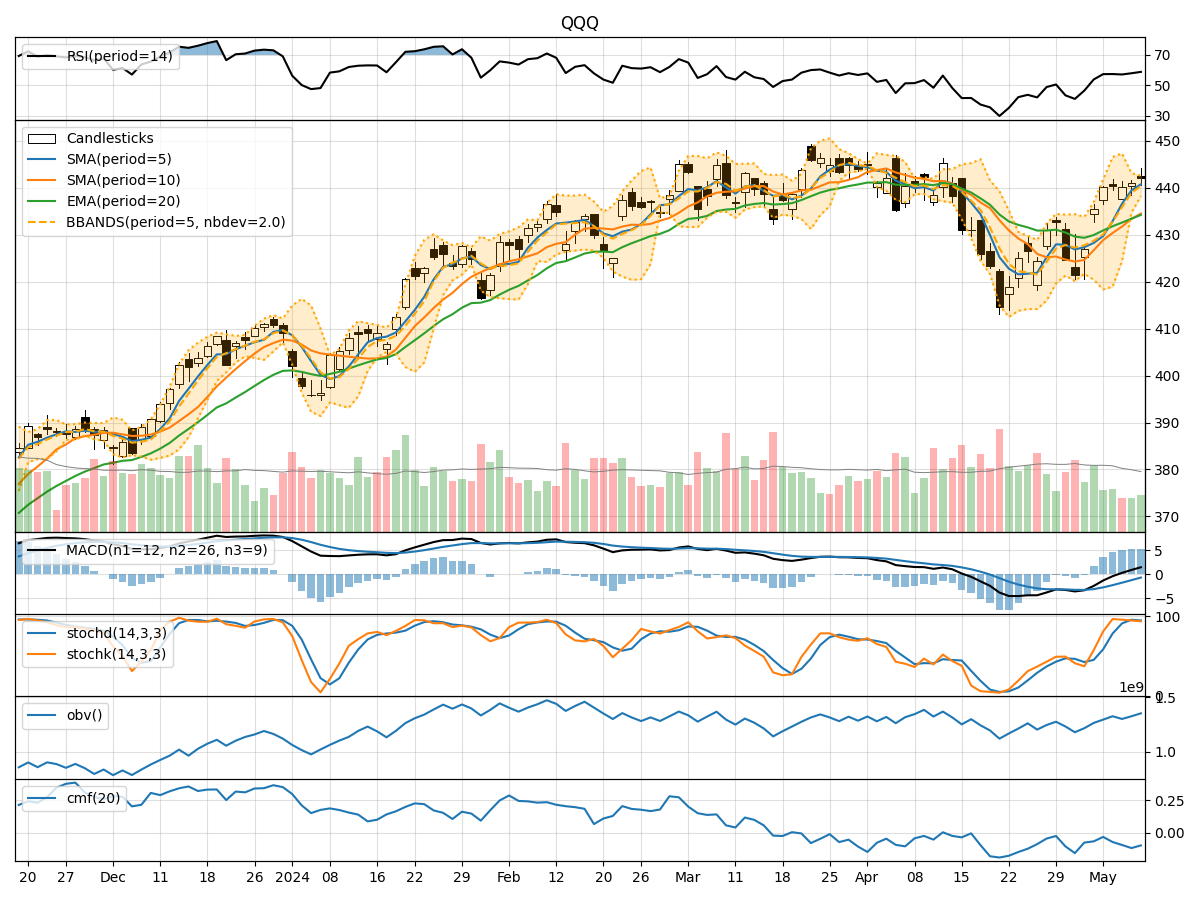
- Moving Averages (MA): The 5-day Moving Average (MA) has been consistently rising, indicating a bullish trend in the short term.
- MACD: The MACD line has been trending upwards, crossing above the signal line, suggesting a bullish momentum.
- RSI: The Relative Strength Index (RSI) is in the neutral zone, indicating a balanced market sentiment.
Momentum Analysis:
- Stochastic Oscillator: Both %K and %D lines of the Stochastic Oscillator are in the overbought zone, signaling a potential reversal or consolidation.
- Williams %R: The Williams %R is in the oversold territory, suggesting a possible buying opportunity.
Volatility Analysis:
- Bollinger Bands (BB): The price has been trading within the Bollinger Bands, with the bands narrowing, indicating reduced volatility.
- BB% (Bollinger Band %B): The %B is below 1, suggesting the price is trading below the lower band, potentially indicating an oversold condition.
Volume Analysis:
- On-Balance Volume (OBV): The OBV has been declining, indicating selling pressure in the market.
- Chaikin Money Flow (CMF): The CMF is negative, suggesting outflow of money from the stock.
Key Observations:
- The trend indicators show a bullish sentiment in the short term.
- Momentum indicators suggest a potential reversal or consolidation due to overbought conditions.
- Volatility indicators point towards reduced price fluctuations.
- Volume indicators indicate selling pressure and a negative money flow.
Conclusion:
Based on the analysis of the technical indicators, the next few days' possible stock price movement for QQQ is likely to experience a short-term consolidation or a minor pullback. The overbought signals from the momentum indicators and the negative volume indicators suggest a temporary pause in the bullish trend. Traders may consider taking profits or waiting for a better entry point before considering long positions. It is essential to monitor the price action closely for any signs of a reversal or continuation of the current trend.