Technical Analysis of QMAR 2024-05-10
Overview:
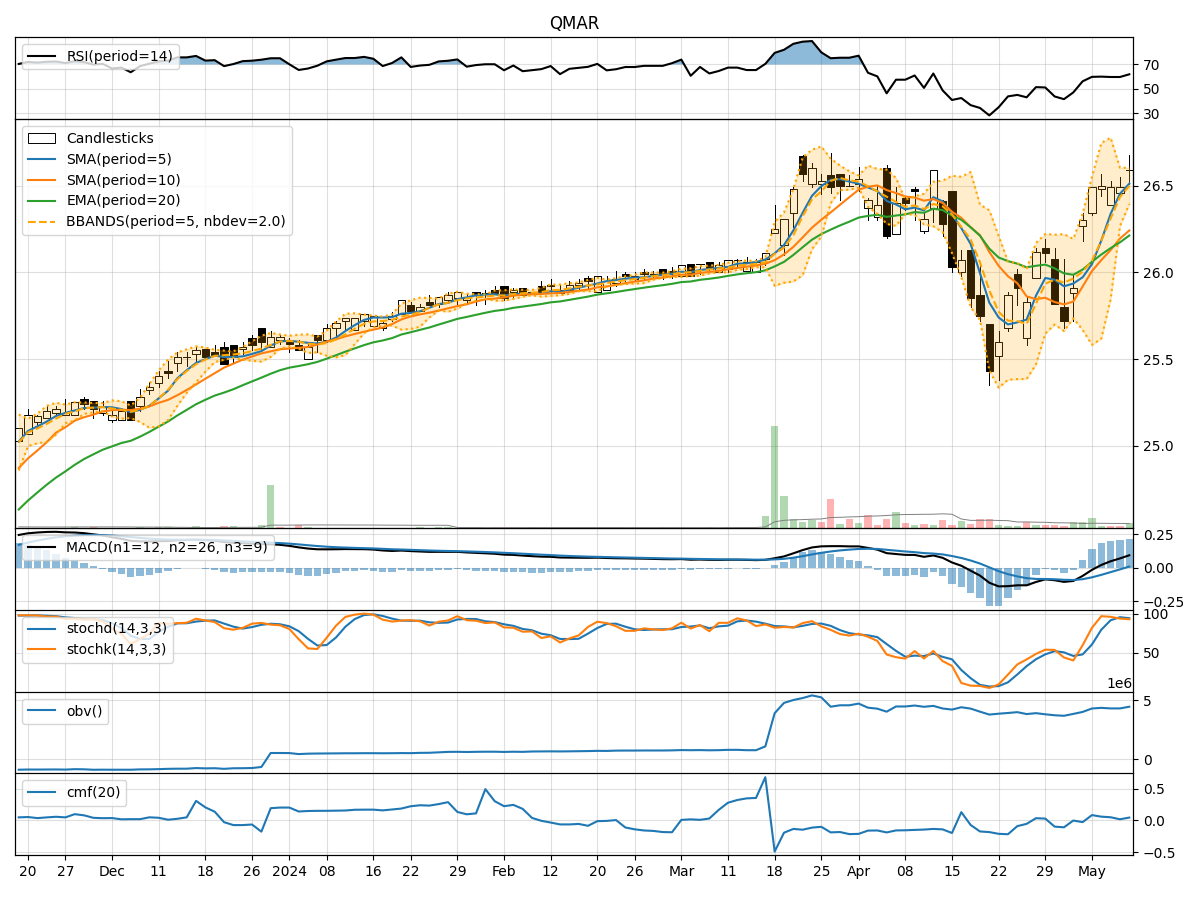
In the last 5 trading days, QMAR stock has shown a relatively stable price movement with minor fluctuations. The technical indicators suggest a neutral to slightly bullish sentiment in the market. Let's delve deeper into the analysis of trend, momentum, volatility, and volume indicators to provide a comprehensive outlook on the possible stock price movement in the next few days.
Trend Indicators:
- Moving Averages (MA): The 5-day Moving Average (MA) has been consistently above the Simple Moving Average (SMA) and Exponential Moving Average (EMA), indicating a short-term bullish trend.
- MACD: The MACD line has been consistently above the signal line, with both lines showing an upward trend, suggesting a bullish momentum in the stock.
Momentum Indicators:
- RSI: The Relative Strength Index (RSI) has been hovering around the neutral zone, indicating neither overbought nor oversold conditions.
- Stochastic Oscillator: Both %K and %D lines of the Stochastic Oscillator are in the overbought territory, suggesting a potential reversal or consolidation.
Volatility Indicators:
- Bollinger Bands (BB): The stock price has been trading within the Bollinger Bands, with the bands narrowing, indicating decreasing volatility and a possible consolidation phase.
Volume Indicators:
- On-Balance Volume (OBV): The OBV has been relatively stable, indicating a balance between buying and selling pressure.
- Chaikin Money Flow (CMF): The CMF has been positive but decreasing, suggesting a potential weakening of buying pressure.
Key Observations:
- The trend indicators point towards a bullish sentiment in the short term.
- Momentum indicators show a mixed signal with RSI neutral and Stochastic Oscillator in the overbought zone.
- Volatility indicators indicate decreasing volatility and a possible consolidation phase.
- Volume indicators suggest a balanced market with a slight decrease in buying pressure.
Conclusion:
Based on the analysis of technical indicators, the next few days' possible stock price movement for QMAR is likely to be sideways with a slight bullish bias. Traders should watch for any signs of reversal or consolidation as the stock may enter a period of stability before potentially resuming its upward trend. It is advisable to closely monitor key support and resistance levels along with any significant news or market developments that could impact the stock price movement.