Technical Analysis of QLD 2024-05-10
Overview:
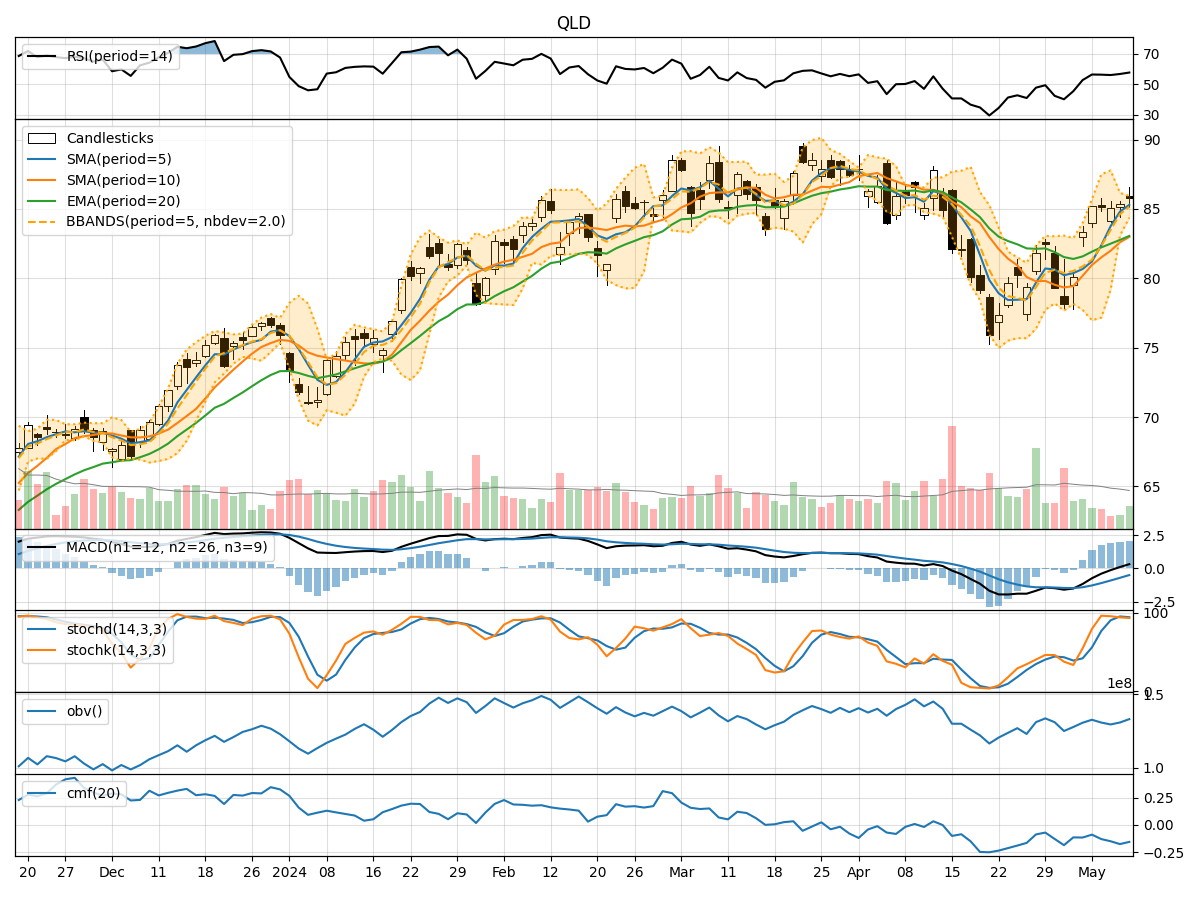
In analyzing the technical indicators for QLD over the last 5 days, we will delve into the trend, momentum, volatility, and volume indicators to provide a comprehensive outlook on the possible stock price movement in the coming days. By examining these key indicators, we aim to offer valuable insights and predictions for potential investors.
Trend Analysis:
- Moving Averages (MA): The 5-day Moving Average has been consistently rising, indicating a bullish trend in the short term.
- MACD: The MACD line has been above the signal line for the past 5 days, suggesting a bullish momentum.
- RSI: The Relative Strength Index has been fluctuating around the 50 level, indicating a neutral stance in terms of momentum.
Momentum Analysis:
- Stochastic Oscillator: Both %K and %D have been relatively high, signaling overbought conditions in the market.
- Williams %R: The Williams %R indicator has been hovering in the oversold territory, suggesting a potential reversal in the near future.
Volatility Analysis:
- Bollinger Bands: The price has been consistently trading above the middle Bollinger Band, indicating an uptrend with low volatility.
- Bollinger %B: The %B indicator has been above 0.5, suggesting a bullish sentiment in the market.
Volume Analysis:
- On-Balance Volume (OBV): The OBV has been declining over the past 5 days, indicating a decrease in buying pressure.
- Chaikin Money Flow (CMF): The CMF has been negative, suggesting a bearish outlook in terms of money flow.
Conclusion:
Based on the analysis of the technical indicators, the stock price of QLD is likely to experience further upward movement in the coming days. The bullish trend indicated by the moving averages and MACD, coupled with the overbought conditions highlighted by the Stochastic Oscillator, point towards a continuation of the current uptrend. However, caution is advised due to the declining OBV and negative CMF, which suggest weakening buying pressure and negative money flow. Traders should closely monitor the price action and key support levels to assess the sustainability of the bullish momentum.