Technical Analysis of QLC 2024-05-10
Overview:
In analyzing the technical indicators for QLC over the last 5 days, we will delve into the trend, momentum, volatility, and volume indicators to provide a comprehensive outlook on the possible stock price movement in the coming days. By examining these key aspects, we aim to offer valuable insights and recommendations for potential investors.
Trend Indicators:
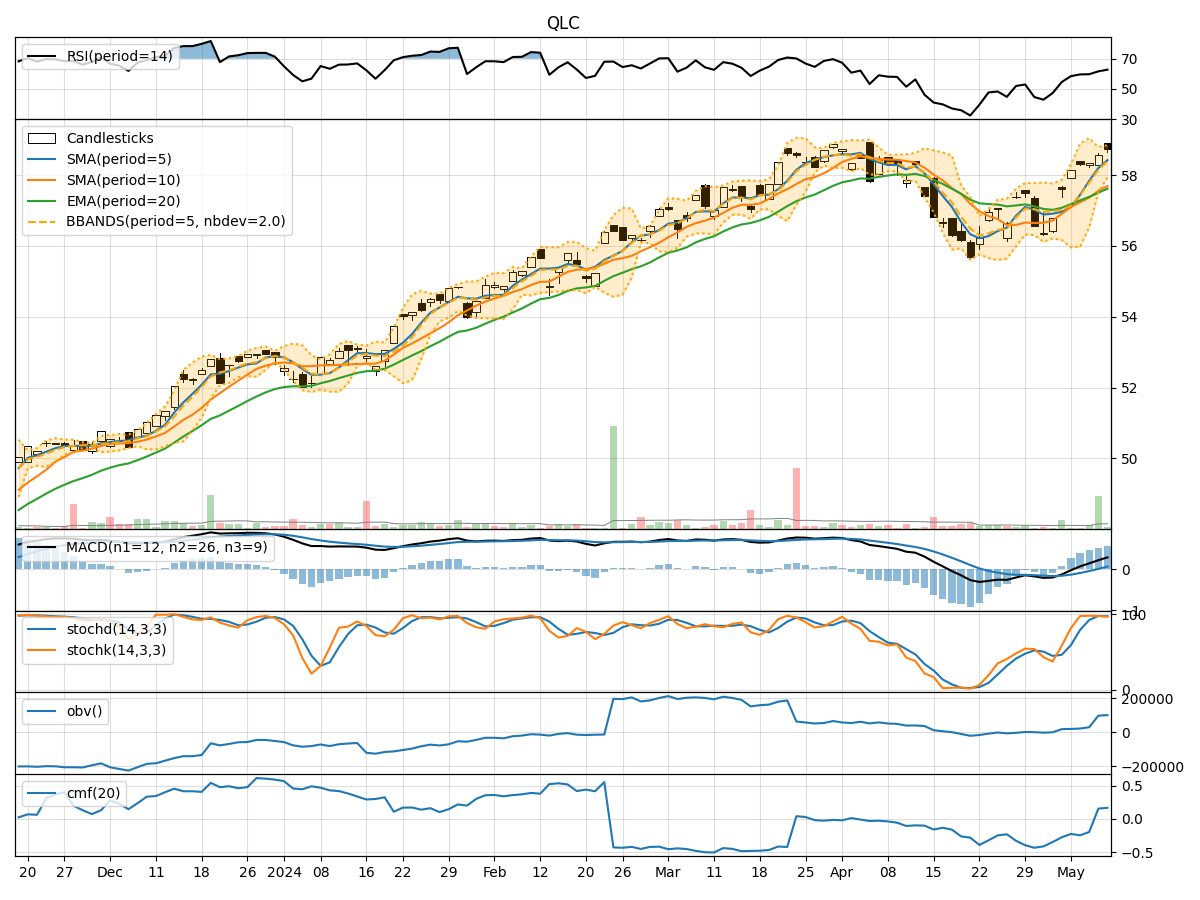
- Moving Averages (MA): The 5-day MA has been consistently above the closing prices, indicating a bullish trend.
- MACD: The MACD line has been above the signal line, suggesting a positive momentum in the stock price.
- RSI: The RSI values have been increasing, reflecting strong buying momentum in the stock.
Momentum Indicators:
- Stochastic Oscillator: Both %K and %D values have been high, signaling an overbought condition.
- Williams %R: The Williams %R values have been negative, indicating a potential reversal in the stock price.
Volatility Indicators:
- Bollinger Bands: The stock price has been trading within the upper Bollinger Band, indicating a period of high volatility.
- BB%: The %B value has been above 0.8, suggesting an overbought condition.
Volume Indicators:
- On-Balance Volume (OBV): The OBV values have been increasing, indicating strong buying pressure.
- Chaikin Money Flow (CMF): The CMF values have been negative, suggesting a bearish sentiment in the stock.
Key Observations:
- The trend indicators show a bullish sentiment with positive moving averages and MACD values.
- Momentum indicators indicate an overbought condition, potentially leading to a price correction.
- Volatility indicators suggest high volatility in the stock price.
- Volume indicators reflect strong buying pressure but with a negative CMF, indicating a bearish sentiment.
Conclusion:
Based on the analysis of the technical indicators, the stock price of QLC is likely to experience a short-term correction due to the overbought condition indicated by the momentum indicators. However, the overall trend remains bullish supported by the moving averages and MACD values. Investors should be cautious of the high volatility and monitor the price closely for potential entry or exit points. Consider taking profits or implementing risk management strategies in anticipation of a possible price pullback.