Technical Analysis of QGRW 2024-05-10
Overview:
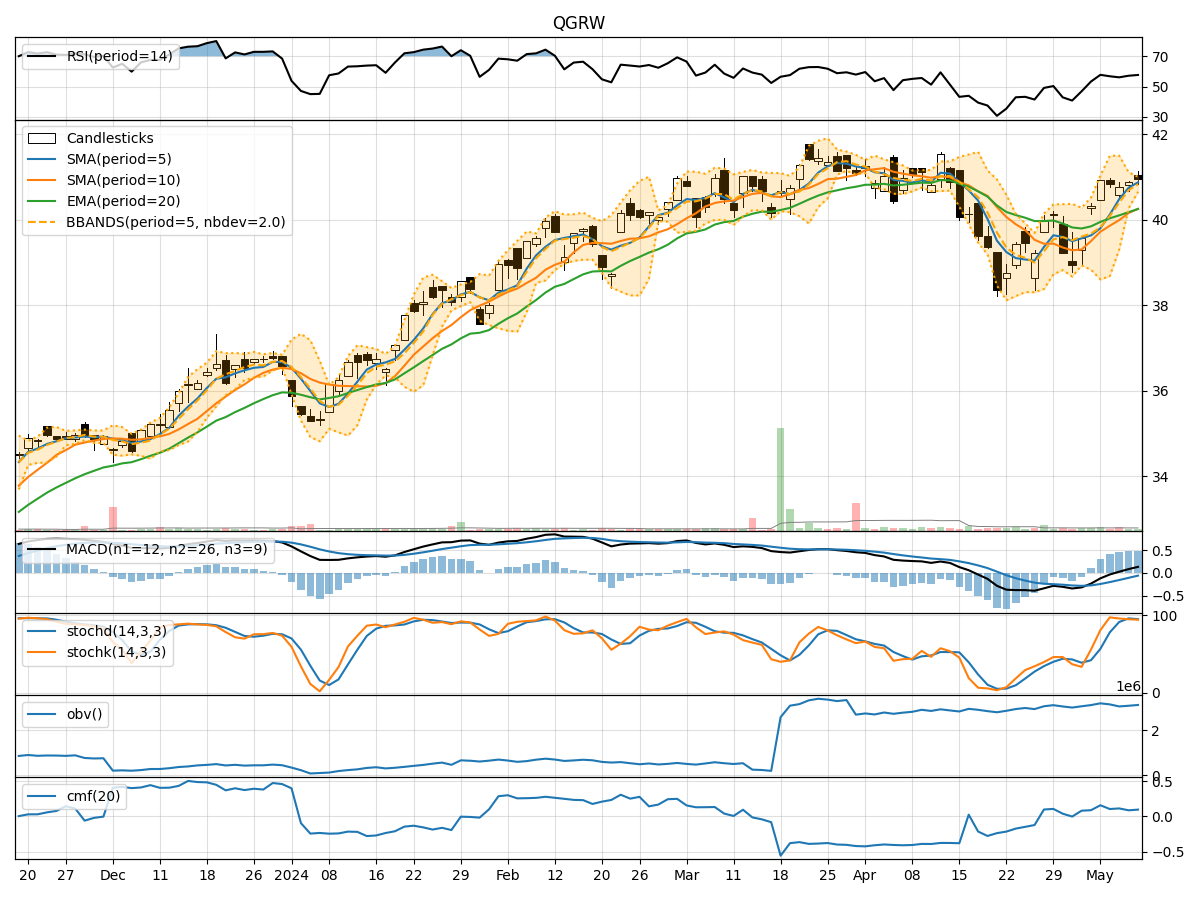
In analyzing the technical indicators for QGRW over the last 5 days, we will delve into the trend, momentum, volatility, and volume indicators to provide a comprehensive outlook on the possible stock price movement in the coming days.
Trend Indicators:
- Moving Averages (MA): The 5-day MA has been consistently above the closing prices, indicating a bullish trend.
- MACD: The MACD line has been consistently above the signal line, suggesting a bullish momentum.
- EMA: The exponential moving average has been trending upwards, supporting the bullish sentiment.
Momentum Indicators:
- RSI: The Relative Strength Index has been hovering around 50, indicating a neutral momentum.
- Stochastic Oscillator: Both %K and %D have been in the overbought zone, signaling a potential reversal.
- Williams %R: The indicator has been in the oversold territory, suggesting a possible bullish reversal.
Volatility Indicators:
- Bollinger Bands: The stock price has been trading within the bands, indicating a period of consolidation.
- Bollinger %B: The %B indicator has been fluctuating around 0.5, reflecting the consolidation phase.
Volume Indicators:
- On-Balance Volume (OBV): The OBV has been relatively stable, indicating a balance between buying and selling pressure.
- Chaikin Money Flow (CMF): The CMF has been positive but not significantly strong, suggesting moderate buying pressure.
Key Observations and Opinions:
- Trend: The trend indicators suggest a bullish sentiment in the short term.
- Momentum: The momentum indicators show mixed signals, with a potential for a bullish reversal.
- Volatility: The volatility indicators point towards a period of consolidation.
- Volume: The volume indicators indicate a balanced market sentiment with moderate buying pressure.
Conclusion:
Based on the analysis of the technical indicators, the next few days for QGRW are likely to see sideways movement with a potential for a bullish reversal. Traders should closely monitor the stochastic oscillator and Williams %R for confirmation of a bullish trend. It is advisable to wait for a clear breakout above key resistance levels before considering long positions.