Technical Analysis of PYLD 2024-05-10
Overview:
In analyzing the technical indicators for PYLD over the last 5 days, we will delve into the trend, momentum, volatility, and volume indicators to provide a comprehensive outlook on the possible stock price movement in the coming days.
Trend Analysis:
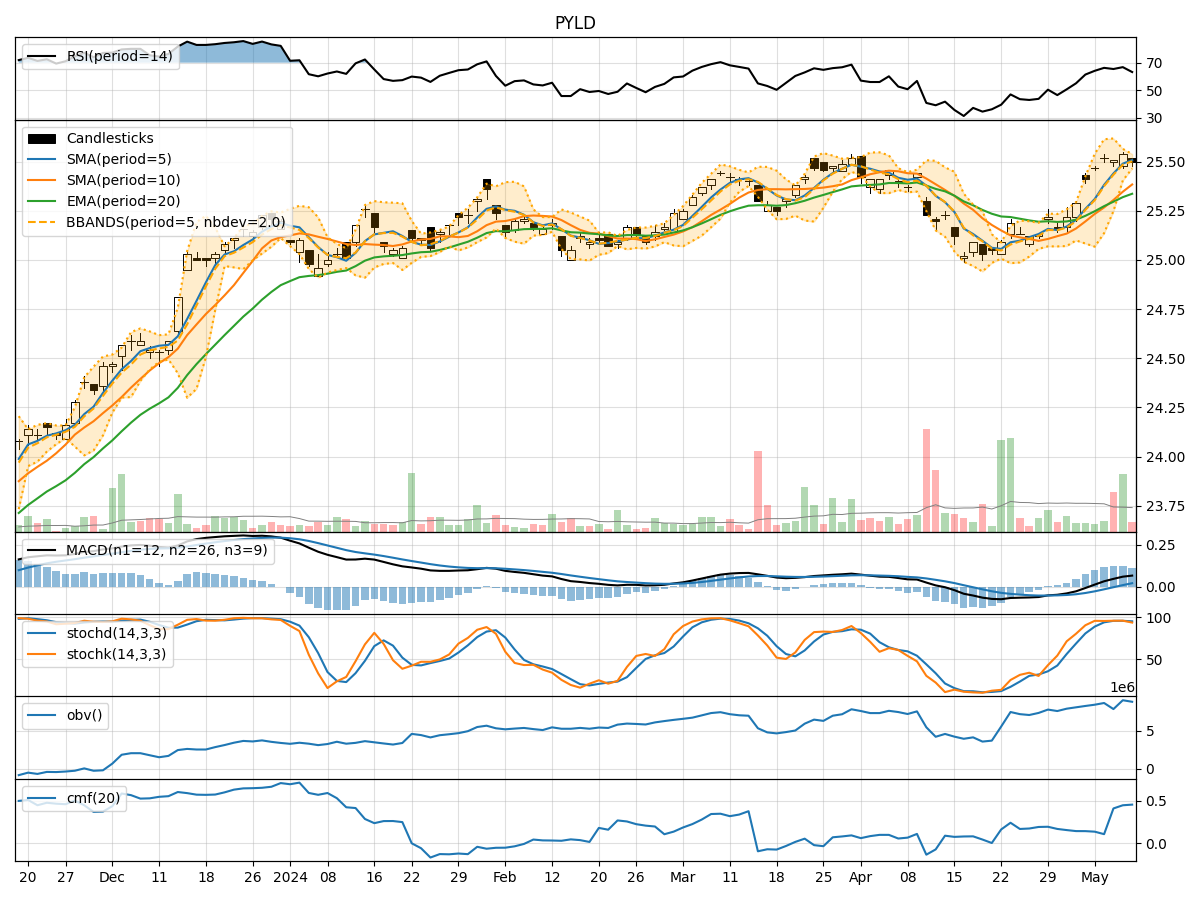
- Moving Averages (MA): The 5-day Moving Average (MA) has been consistently above the Simple Moving Average (SMA) and Exponential Moving Average (EMA), indicating a bullish trend.
- MACD: The MACD line has been above the signal line, with both lines showing an upward trend, suggesting bullish momentum.
Momentum Analysis:
- RSI: The Relative Strength Index (RSI) has been in the range of 60-70, indicating a neutral to slightly bullish momentum.
- Stochastic Oscillator: Both %K and %D have been in the overbought zone, suggesting a potential reversal or consolidation.
Volatility Analysis:
- Bollinger Bands (BB): The stock price has been trading within the upper and lower Bollinger Bands, indicating a period of volatility and potential price expansion.
Volume Analysis:
- On-Balance Volume (OBV): The OBV has shown mixed signals, with fluctuations in volume accumulation, reflecting indecision among market participants.
- Chaikin Money Flow (CMF): The CMF has been positive, indicating buying pressure in the stock.
Key Observations:
- The trend indicators suggest a strong bullish sentiment in the short term.
- Momentum indicators show a potential overbought condition, signaling a need for caution.
- Volatility indicators point towards potential price expansion and increased market activity.
- Volume indicators reflect mixed signals, with a slight bias towards buying pressure.
Conclusion:
Based on the analysis of the technical indicators, the stock price of PYLD is likely to experience further upward movement in the coming days. However, caution is advised due to the potential overbought condition indicated by the momentum indicators. Traders should closely monitor price action within the Bollinger Bands for potential breakouts or reversals. Overall, the outlook remains bullish with a possibility of consolidation in the near term.