Technical Analysis of PWZ 2024-05-10
Overview:
In analyzing the technical indicators for PWZ stock over the last 5 days, we will delve into the trend, momentum, volatility, and volume indicators to provide a comprehensive outlook on the possible future stock price movement. By examining these key indicators, we aim to offer valuable insights and predictions for the upcoming trading days.
Trend Analysis:
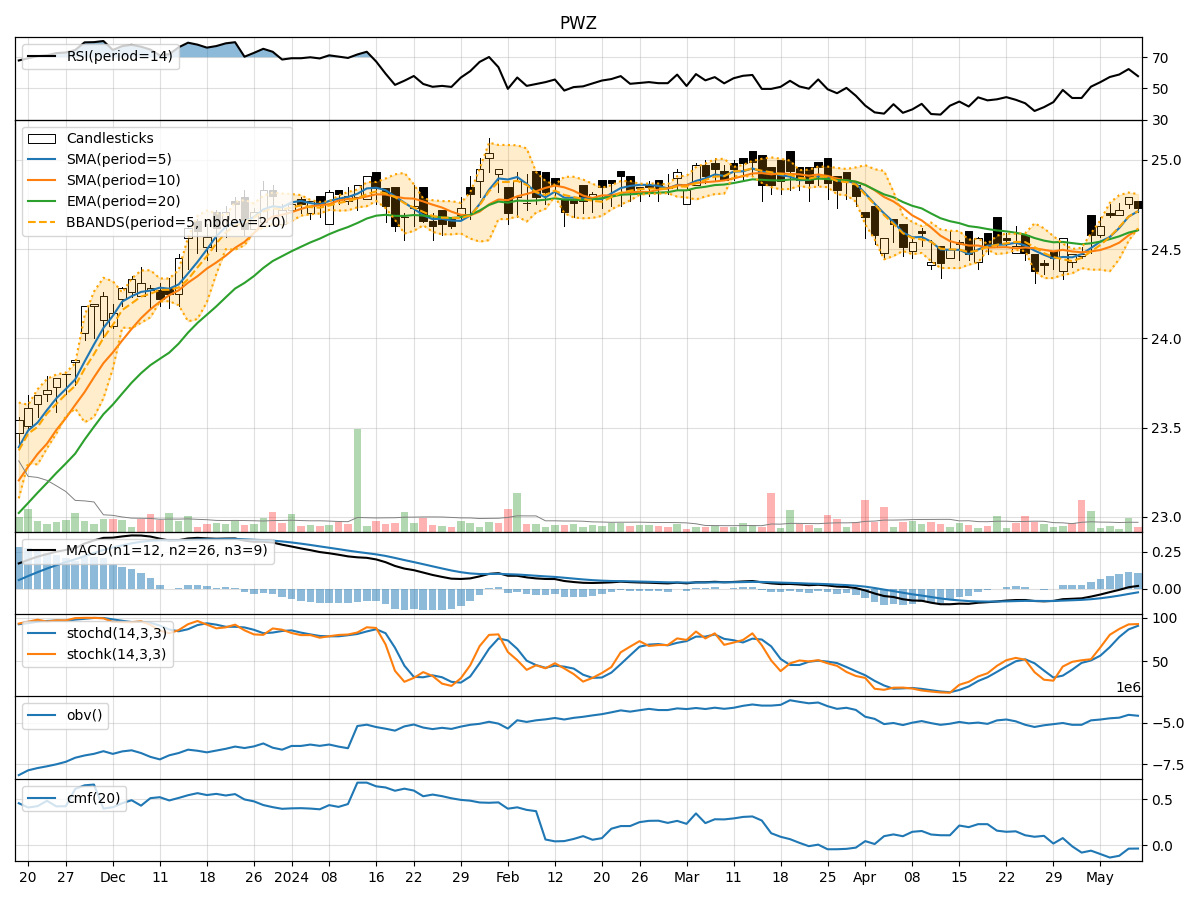
- Moving Averages (MA): The 5-day Moving Average (MA) has been consistently above the Simple Moving Average (SMA) and Exponential Moving Average (EMA), indicating a bullish trend.
- MACD: The MACD line has been consistently above the signal line, with both lines showing an upward trend, suggesting bullish momentum.
- MACD Histogram: The MACD Histogram has been increasing over the past 5 days, indicating strengthening bullish momentum.
Momentum Analysis:
- RSI: The Relative Strength Index (RSI) has been fluctuating but generally staying within the neutral range, suggesting a balanced momentum.
- Stochastic Oscillator: Both %K and %D lines of the Stochastic Oscillator have been in the overbought zone, indicating a potential reversal or consolidation.
- Williams %R: The Williams %R has been fluctuating in the oversold and overbought zones, reflecting mixed momentum signals.
Volatility Analysis:
- Bollinger Bands: The Bollinger Bands have been narrowing, indicating decreasing volatility and a potential upcoming breakout.
- Bollinger %B: The %B indicator has been fluctuating within a range, suggesting a lack of clear direction in volatility.
Volume Analysis:
- On-Balance Volume (OBV): The OBV has been fluctuating but generally showing a slight increase, indicating some accumulation.
- Chaikin Money Flow (CMF): The CMF has been negative, suggesting some selling pressure in the stock.
Key Observations:
- The trend indicators suggest a bullish sentiment with moving averages and MACD signaling upward momentum.
- Momentum indicators show mixed signals with RSI in a neutral range and stochastic oscillators indicating potential reversal.
- Volatility indicators point towards decreasing volatility and a possible breakout in the near future.
- Volume indicators reflect some accumulation but also highlight selling pressure based on OBV and CMF.
Conclusion:
Based on the analysis of the technical indicators, the next few days' possible stock price movement for PWZ is likely to be bullish in the short term. The trend indicators support a bullish outlook, while momentum indicators show mixed signals that may lead to a consolidation phase before a potential upward movement. Volatility is expected to increase, indicating a possible breakout, and volume indicators suggest a balance between accumulation and selling pressure. Overall, considering the current market dynamics, the stock is poised for an upward movement in the coming days.