Technical Analysis of PVAL 2024-05-10
Overview:
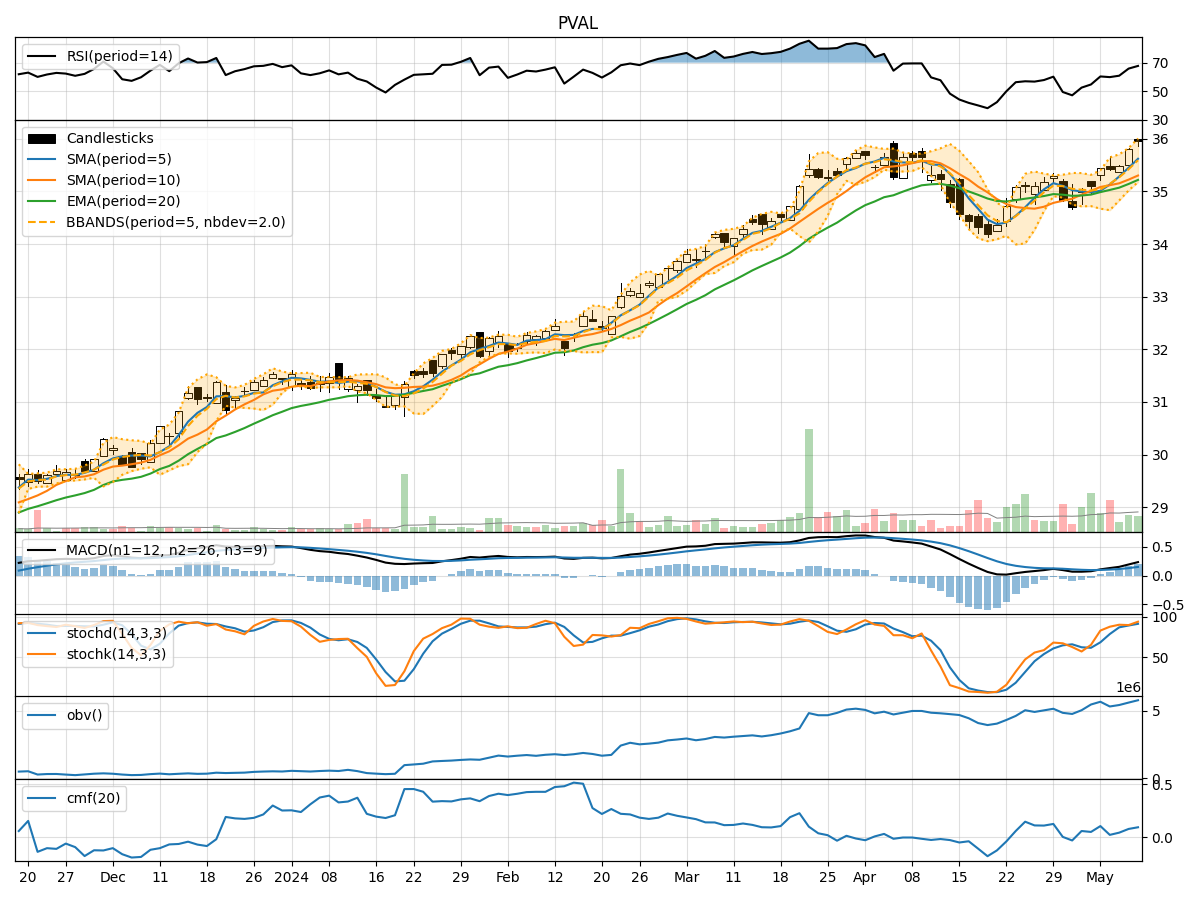
In the last 5 trading days, PVAL stock has shown a consistent uptrend in its closing price, accompanied by increasing volumes. The moving averages have been trending upwards, indicating a positive momentum. The MACD and RSI have also been showing bullish signals. However, the stock has entered overbought territory based on the stochastic indicators. The Bollinger Bands suggest a slight expansion in volatility. Overall, the stock seems to be in a bullish phase but may face some resistance due to overbought conditions.
Trend Indicators Analysis:
- Moving Averages (MA): The 5-day MA has been consistently above the longer-term SMAs, indicating a short-term bullish trend.
- MACD: The MACD line has been above the signal line, showing bullish momentum.
- MACD Histogram: The histogram has been increasing, indicating strengthening bullish momentum.
Key Observation: The trend indicators suggest a strong bullish trend in the stock price.
Momentum Indicators Analysis:
- RSI: The RSI has been increasing and is in the overbought zone, suggesting a potential reversal or consolidation.
- Stochastic Oscillator: Both %K and %D have been in the overbought zone, indicating a possible pullback.
- Williams %R: The indicator is also in the overbought region, signaling a potential reversal.
Key Observation: Momentum indicators are showing signs of overbought conditions, hinting at a possible correction or consolidation.
Volatility Indicators Analysis:
- Bollinger Bands: The bands have slightly widened, indicating a potential increase in volatility.
Key Observation: Volatility is expected to increase, which could lead to larger price swings.
Volume Indicators Analysis:
- On-Balance Volume (OBV): The OBV has been increasing, reflecting strong buying pressure.
- Chaikin Money Flow (CMF): The CMF is positive, indicating money flow into the stock.
Key Observation: Volume indicators suggest strong buying interest in the stock.
Conclusion:
Based on the technical analysis of PVAL stock: - Trend: The stock is in a strong bullish trend. - Momentum: Momentum indicators signal overbought conditions, suggesting a potential pullback or consolidation. - Volatility: Volatility is expected to increase, leading to larger price movements. - Volume: Strong buying pressure is indicated by volume indicators.
Recommendation:
Considering the overall analysis, while the stock is currently in a bullish phase, the overbought conditions highlighted by momentum indicators suggest a potential pullback or consolidation in the near term. Traders may consider taking profits or tightening stop-loss levels. Long-term investors could use any dips as buying opportunities to capitalize on the overall bullish trend. Monitoring the stock closely for signs of a reversal or continuation of the uptrend is advisable.