Technical Analysis of PTRB 2024-05-10
Overview:
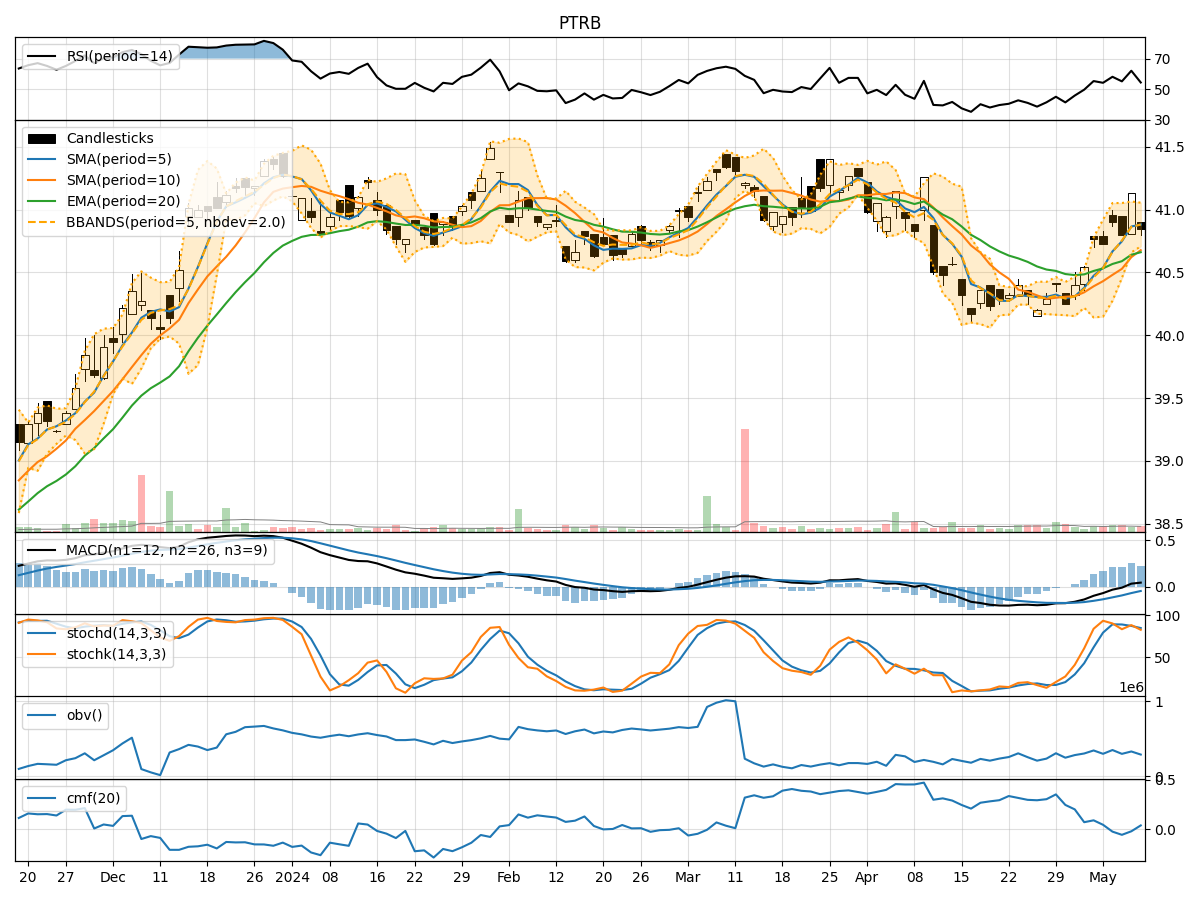
In analyzing the technical indicators for PTRB over the last 5 days, we will delve into the trend, momentum, volatility, and volume indicators to provide a comprehensive outlook on the possible stock price movement in the coming days.
Trend Analysis:
- Moving Averages (MA): The 5-day Moving Average (MA) has been consistently above the Simple Moving Average (SMA) and Exponential Moving Average (EMA) over the past 5 days, indicating a short-term uptrend.
- MACD: The Moving Average Convergence Divergence (MACD) has shown positive values, with the MACD line consistently above the Signal line, suggesting bullish momentum.
Momentum Analysis:
- RSI: The Relative Strength Index (RSI) has been fluctuating around the neutral zone, indicating indecision in the market.
- Stochastic Oscillator: Both %K and %D have been declining, signaling a potential reversal in momentum.
Volatility Analysis:
- Bollinger Bands (BB): The stock price has been trading within the Bollinger Bands, with the bands narrowing, indicating decreasing volatility.
Volume Analysis:
- On-Balance Volume (OBV): The OBV has been fluctuating, suggesting mixed sentiment among investors.
- Chaikin Money Flow (CMF): The CMF has been negative, indicating selling pressure in the market.
Key Observations:
- The trend indicators suggest a short-term uptrend in the stock price.
- Momentum indicators show mixed signals, with RSI indicating neutrality and Stochastic Oscillator hinting at a potential reversal.
- Volatility has been decreasing, as seen in the narrowing Bollinger Bands.
- Volume indicators reflect mixed sentiment among investors, with OBV fluctuating and CMF showing selling pressure.
Conclusion:
Based on the analysis of the technical indicators, the next few days' possible stock price movement for PTRB is likely to be sideways with a slight bearish bias. The trend indicators support a short-term uptrend, but the mixed signals from momentum indicators and selling pressure indicated by volume indicators suggest a lack of strong bullish momentum. Additionally, the decreasing volatility implies a period of consolidation or sideways movement in the stock price. Traders should exercise caution and closely monitor key support and resistance levels for potential entry or exit points.