Technical Analysis of PTNQ 2024-05-10
Overview:
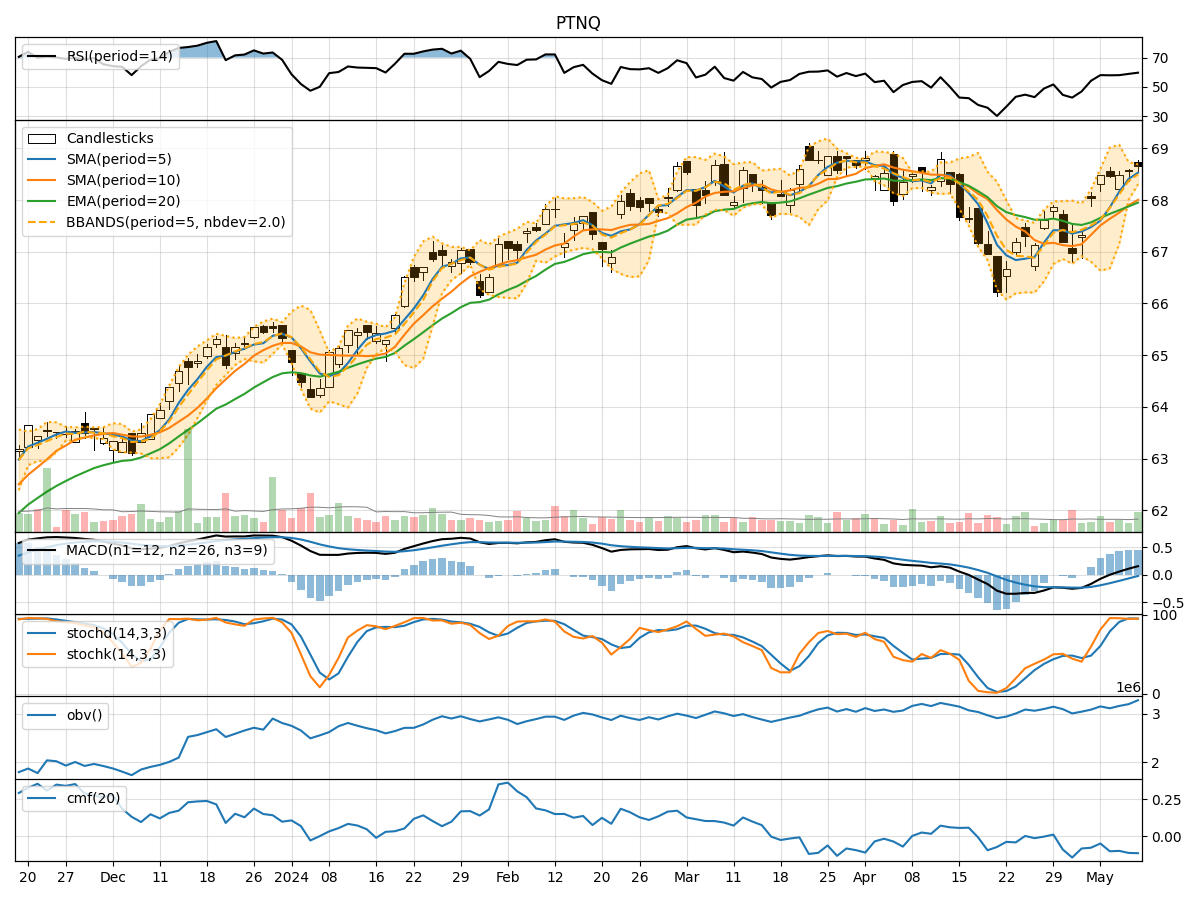
In analyzing the technical indicators for PTNQ over the last 5 days, we will delve into the trend, momentum, volatility, and volume indicators to provide a comprehensive outlook on the possible stock price movement in the coming days.
Trend Analysis:
- Moving Averages (MA): The 5-day Moving Average (MA) has been consistently above the Simple Moving Average (SMA) and Exponential Moving Average (EMA), indicating a bullish trend.
- MACD: The MACD line has been consistently above the signal line, with both lines showing an upward trend, suggesting bullish momentum.
- MACD Histogram: The MACD Histogram has been increasing over the past 5 days, indicating strengthening bullish momentum.
Momentum Analysis:
- RSI: The Relative Strength Index (RSI) has been gradually increasing and is currently in the bullish zone above 50, indicating increasing buying pressure.
- Stochastic Oscillator: Both %K and %D lines of the Stochastic Oscillator are in the overbought zone, suggesting a potential reversal or consolidation.
- Williams %R: The Williams %R is in the oversold territory, indicating a potential buying opportunity.
Volatility Analysis:
- Bollinger Bands (BB): The stock price has been trading within the Bollinger Bands, with the bands narrowing, suggesting a period of consolidation.
- Bollinger %B: The %B indicator is hovering around 1, indicating that the stock price is at the upper band, potentially signaling an overbought condition.
Volume Analysis:
- On-Balance Volume (OBV): The OBV has been steadily increasing over the past 5 days, indicating accumulation by investors.
- Chaikin Money Flow (CMF): The CMF has been negative, suggesting some selling pressure in the stock.
Conclusion:
Based on the analysis of the technical indicators, the stock price of PTNQ is likely to experience further upward movement in the coming days. The bullish trend indicated by the moving averages and MACD, coupled with the increasing RSI and OBV, suggests that buyers are in control. However, caution is advised as the Stochastic Oscillator is in the overbought zone, indicating a potential reversal or consolidation. Traders should closely monitor the price action and consider taking profits if the stock reaches overbought levels.